Skip to content
  • Categories
  • Recent
  • Tags
  • Popular
  • World
  • Users
  • Groups
Skins
  • Light
  • Brite
  • Cerulean
  • Cosmo
  • Flatly
  • Journal
  • Litera
  • Lumen
  • Lux
  • Materia
  • Minty
  • Morph
  • Pulse
  • Sandstone
  • Simplex
  • Sketchy
  • Spacelab
  • United
  • Yeti
  • Zephyr
  • Dark
  • Cyborg
  • Darkly
  • Quartz
  • Slate
  • Solar
  • Superhero
  • Vapor

  • Default (No Skin)
  • No Skin
Collapse
Zircon3D

📢 Zircon3D v2.2 Released! Check Out What’s New!

Tami LiuT

Tami Liu

@Tami Liu
administrators
About
Posts
57
Topics
39
Shares
0
Groups
1
Followers
0
Following
0

Posts

Recent Best Controversial

  • 3D IoT Visualization: How Zircon3D Connects Real-Time Sensor Data to a Digital Twin
    Tami LiuT Tami Liu

    Learn how Zircon3D maps real-time IoT sensor data to interactive 3D models, heatmaps, dashboards, and digital twin views through Home Assistant.

    Collecting IoT sensor data is usually not the hardest part of an IoT project.

    Platforms such as Home Assistant, MQTT brokers, building management systems, gateways, and industrial controllers can already collect temperature, humidity, air quality, occupancy, energy, equipment status, and other measurements.

    The more difficult question is:

    How can we show real-time IoT sensor data in its actual physical location inside a 3D model?

    A traditional IoT dashboard presents values through cards, charts, tables, and gauges. These are useful, but they often remove the spatial context of the data. A value may tell you that one sensor reports a high temperature, but it does not immediately show where that sensor is located, which room is affected, or what equipment is nearby.

    A 3D IoT visualization adds this missing spatial context.

    Instead of looking at an isolated list of sensor values, users can see the building, room, greenhouse, office, facility, or equipment layout and understand what is happening in the real environment.

    This is the type of problem Zircon3D is designed to solve.
    84fd0249-14ce-4246-93cd-565916922892-zircon3d-3d-iot-visualization-digital-twin-2.png
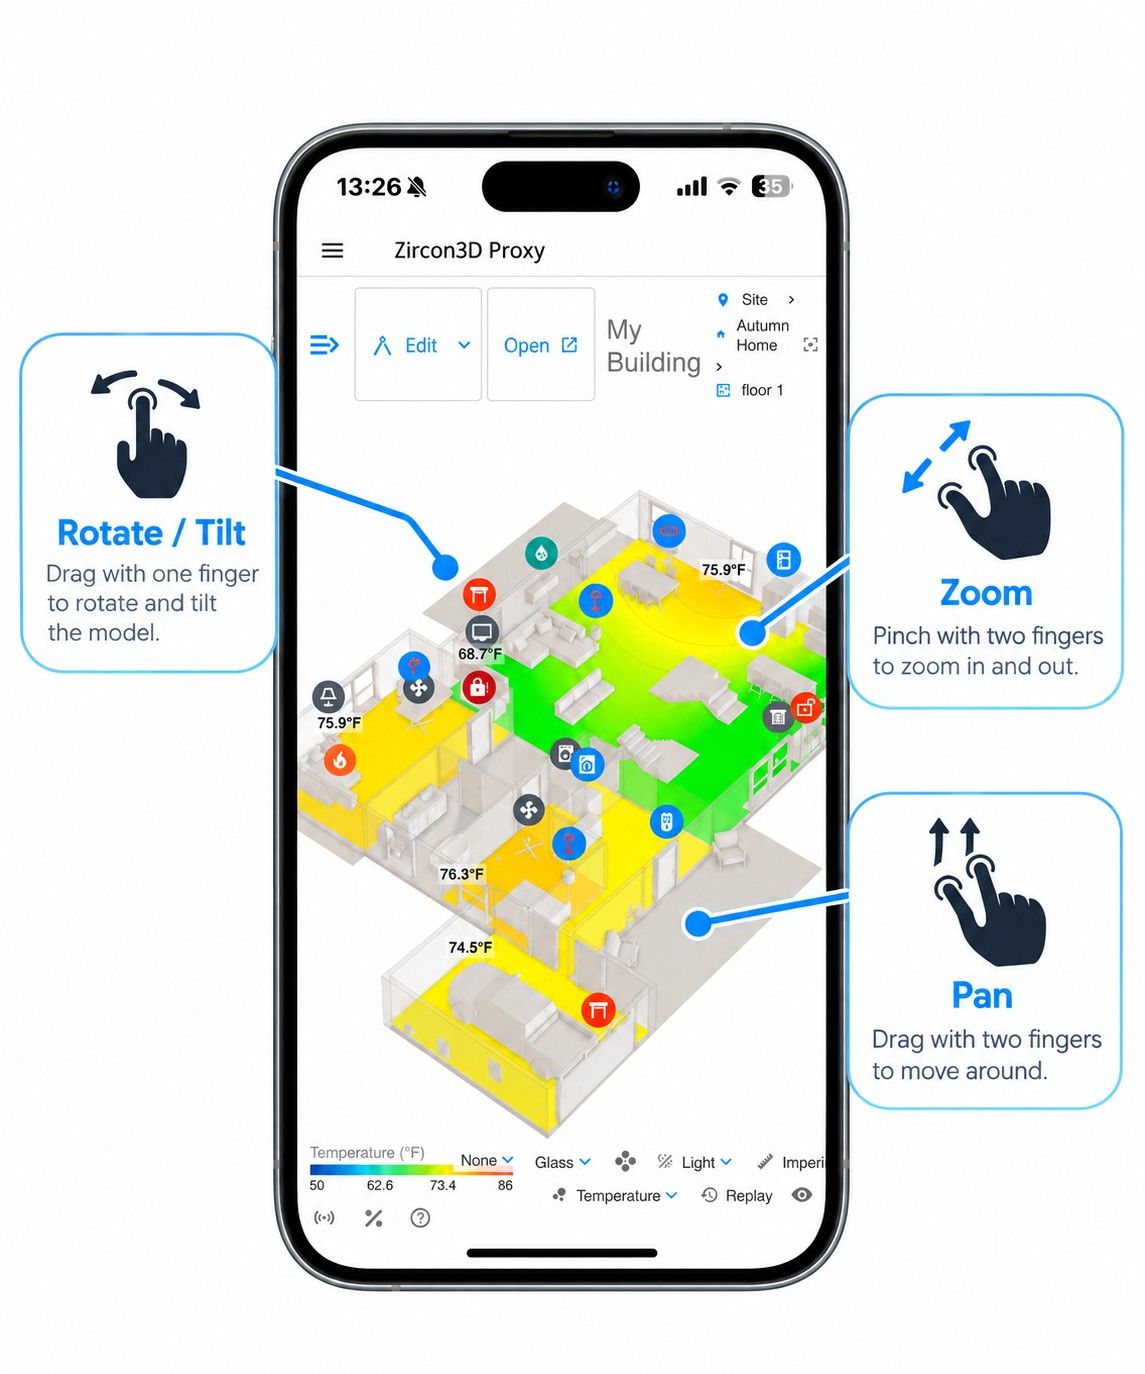
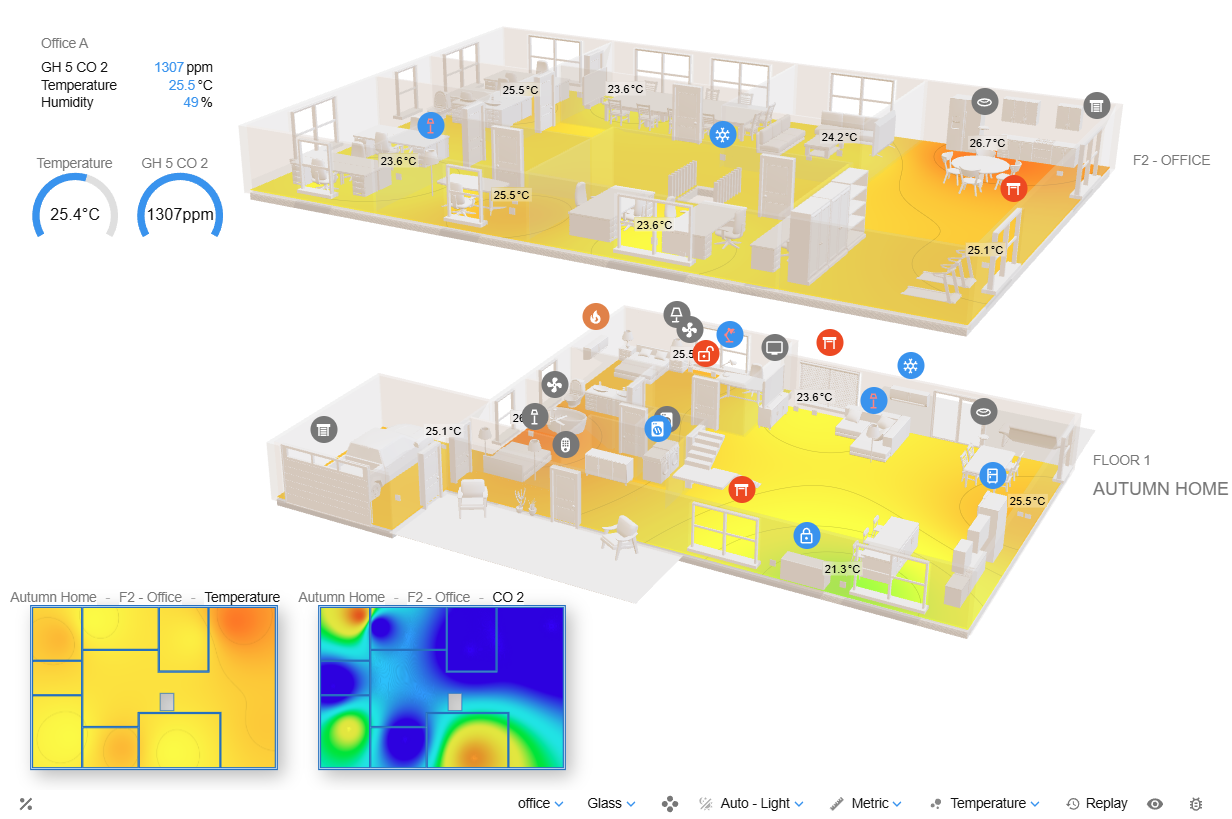
    Zircon3D combines an interactive 3D environment with real-time IoT sensor data, heatmaps, dashboards, and device controls

    What Is a 3D IoT Digital Twin?

    The term “digital twin” can describe several different types of systems.

    At the most advanced level, a digital twin may include engineering simulation, predictive models, structural analysis, physics calculations, maintenance planning, and lifecycle management.

    However, many IoT projects have a more practical objective:

    • Display a building or facility as an interactive 3D model.
    • Place sensors and connected devices in their real locations.
    • Show live values and device states.
    • Highlight environmental conditions with heatmaps.
    • Review historical changes.
    • Control supported devices from the same interface.

    This can be described as a visual or operational digital twin.

    Its purpose is not to simulate every physical process. Its purpose is to create a live spatial view of the real environment so that operators can understand conditions more quickly.

    Zircon3D focuses on this visualization layer.

    The Traditional Way: Building a Custom 3D IoT Application

    A developer building a 3D IoT visualization from scratch may consider a technology stack such as:

    • Blender for creating the 3D model.
    • glTF or GLB for exporting the model.
    • Three.js, Babylon.js, or Unity for rendering.
    • MQTT or WebSocket for real-time communication.
    • A backend service for authentication and device mapping.
    • A database for current and historical sensor values.
    • Custom shaders, labels, charts, and user-interface components.
    • Custom code to associate sensor IDs with objects in the 3D scene.

    This approach offers complete control, but it can quickly become a large software-development project.

    Rendering a model is only the beginning. The application must also manage camera controls, model optimization, device synchronization, data mapping, sensor history, user permissions, mobile performance, dashboards, error handling, and deployment.

    For a research project or highly specialized industrial application, custom development may be appropriate. For a smart home, greenhouse, office, school, laboratory, farm, or small facility, building all of these components from the beginning may not be necessary.

    Zircon3D provides these capabilities as a ready-to-use visualization platform.
    03dda3cf-d0af-419f-b684-4fcfb0d02072-3d-builder.png

    Creating the 3D Environment

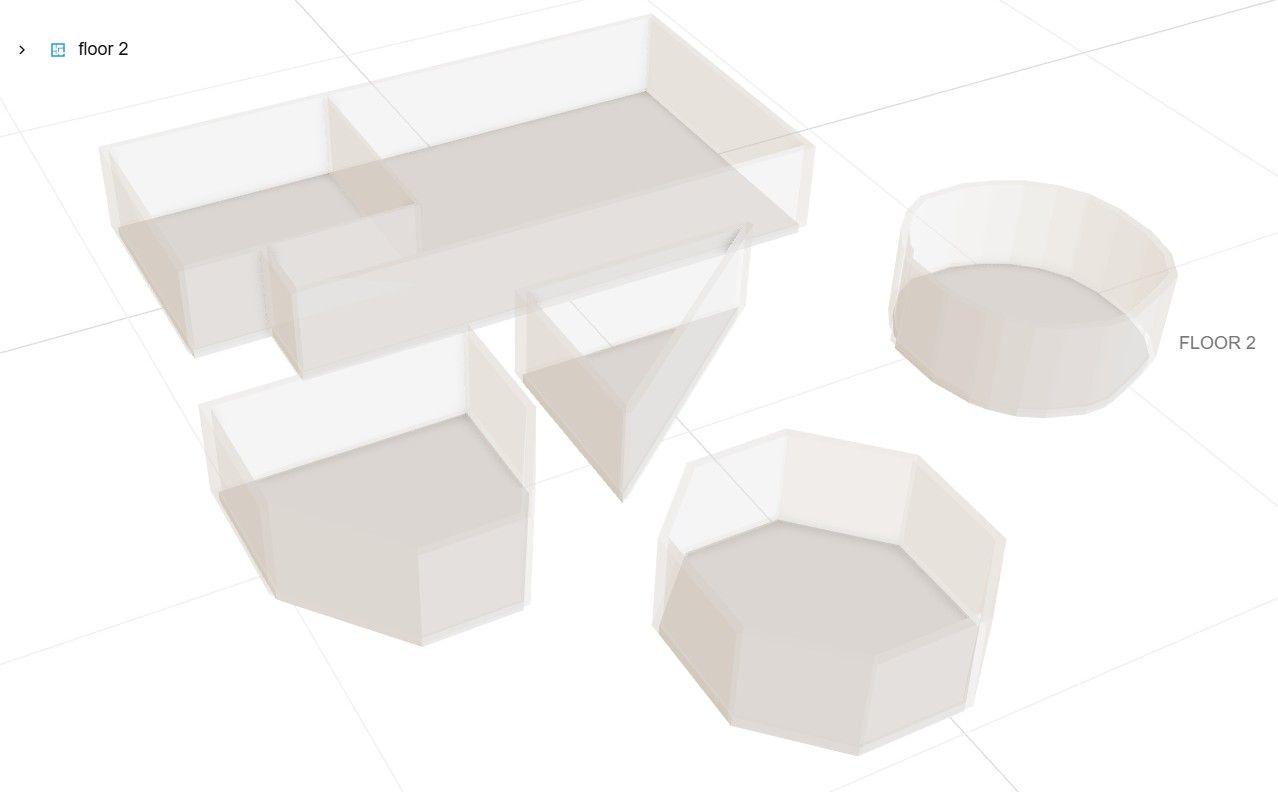
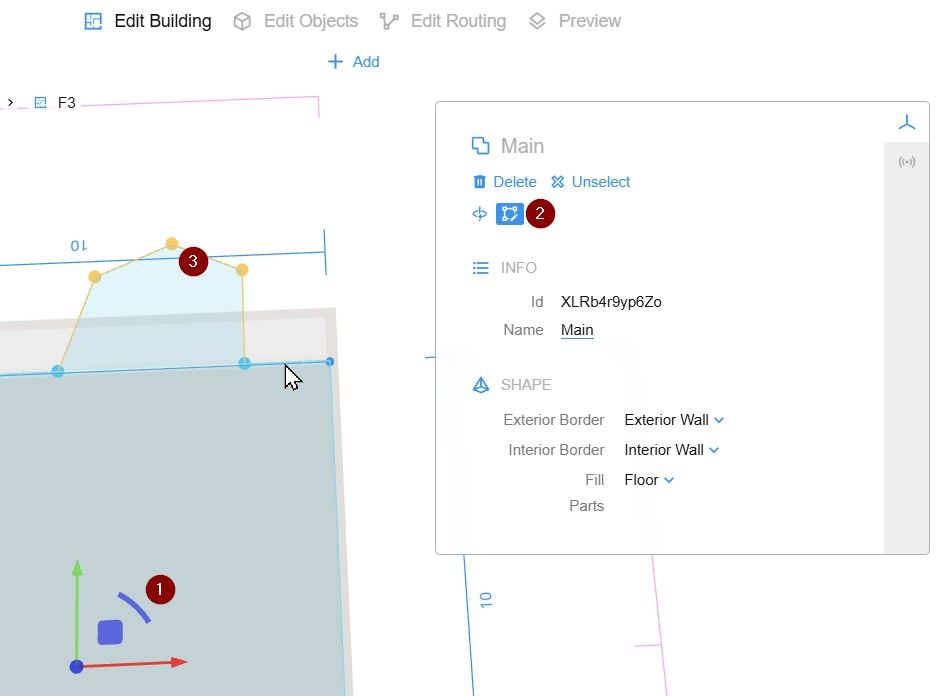
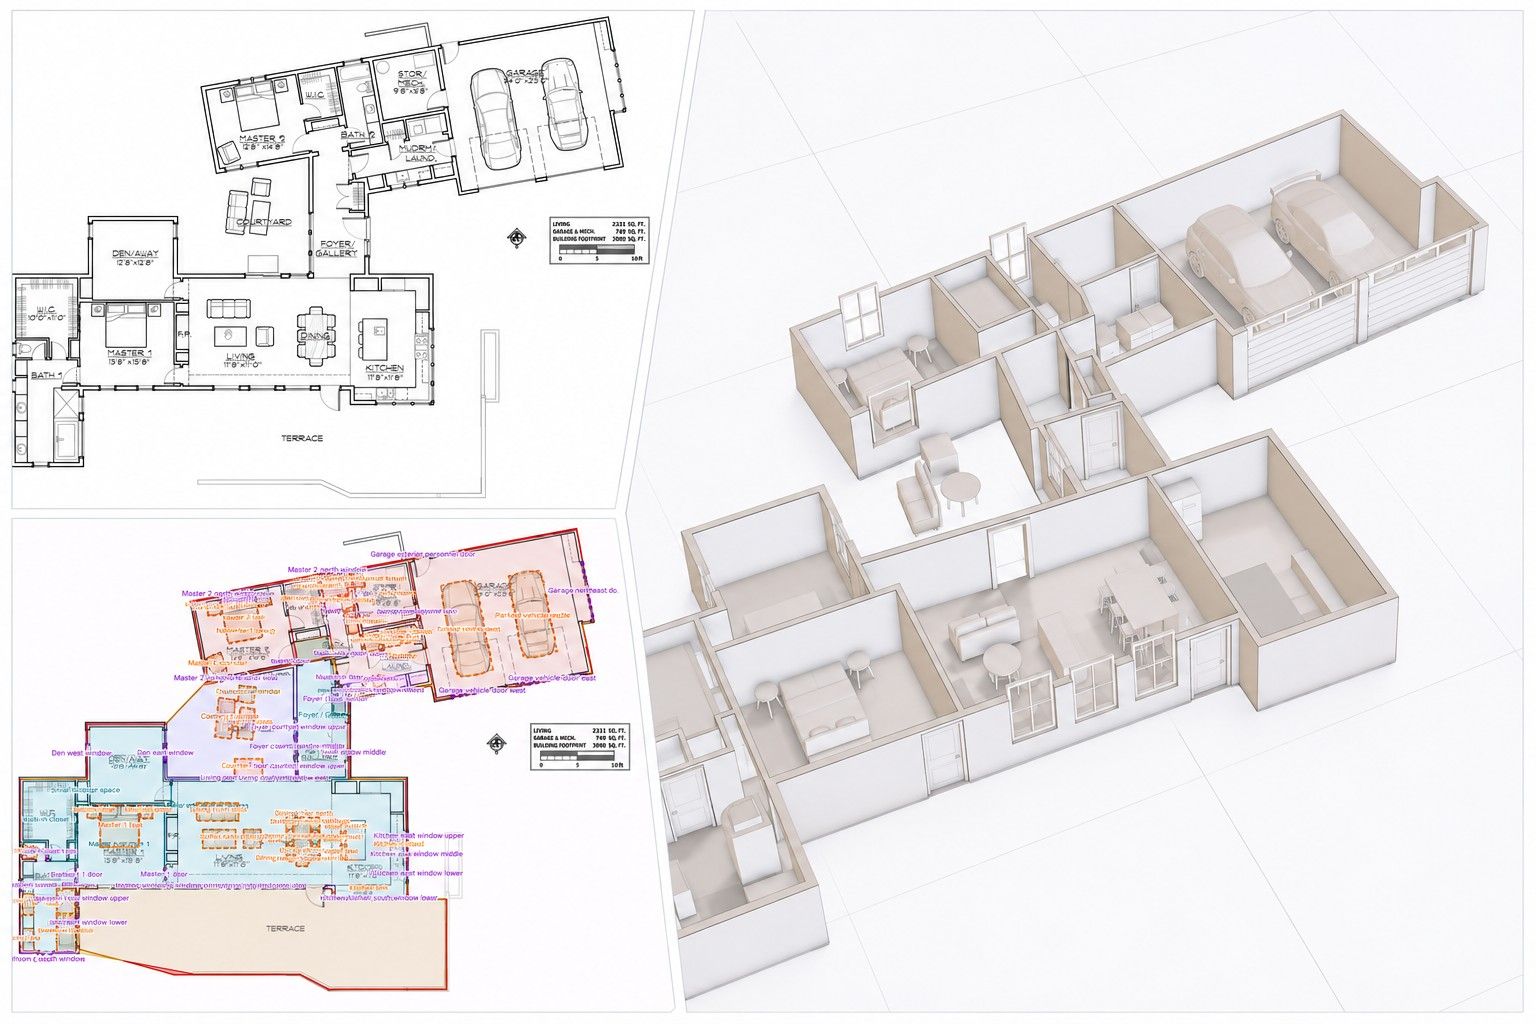
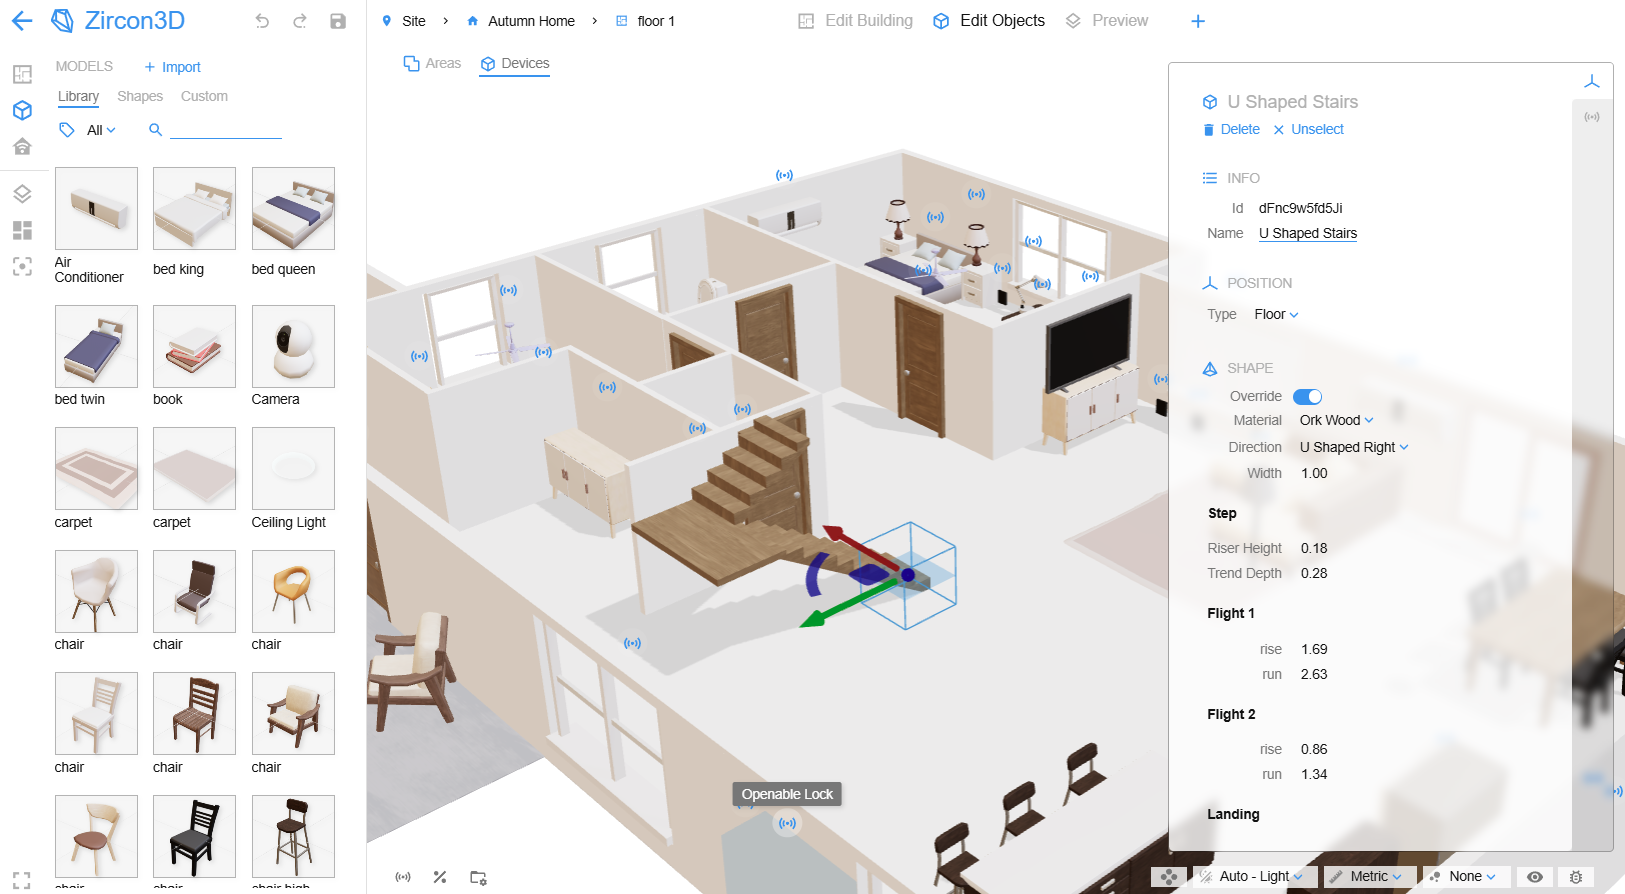
    Zircon3D includes a visual designer for creating buildings, floors, walls, rooms, doors, windows, furniture, and other objects.

    Users do not need to create the entire building in Blender or write code to display it. The floorplan can be created directly in the Zircon3D Designer.

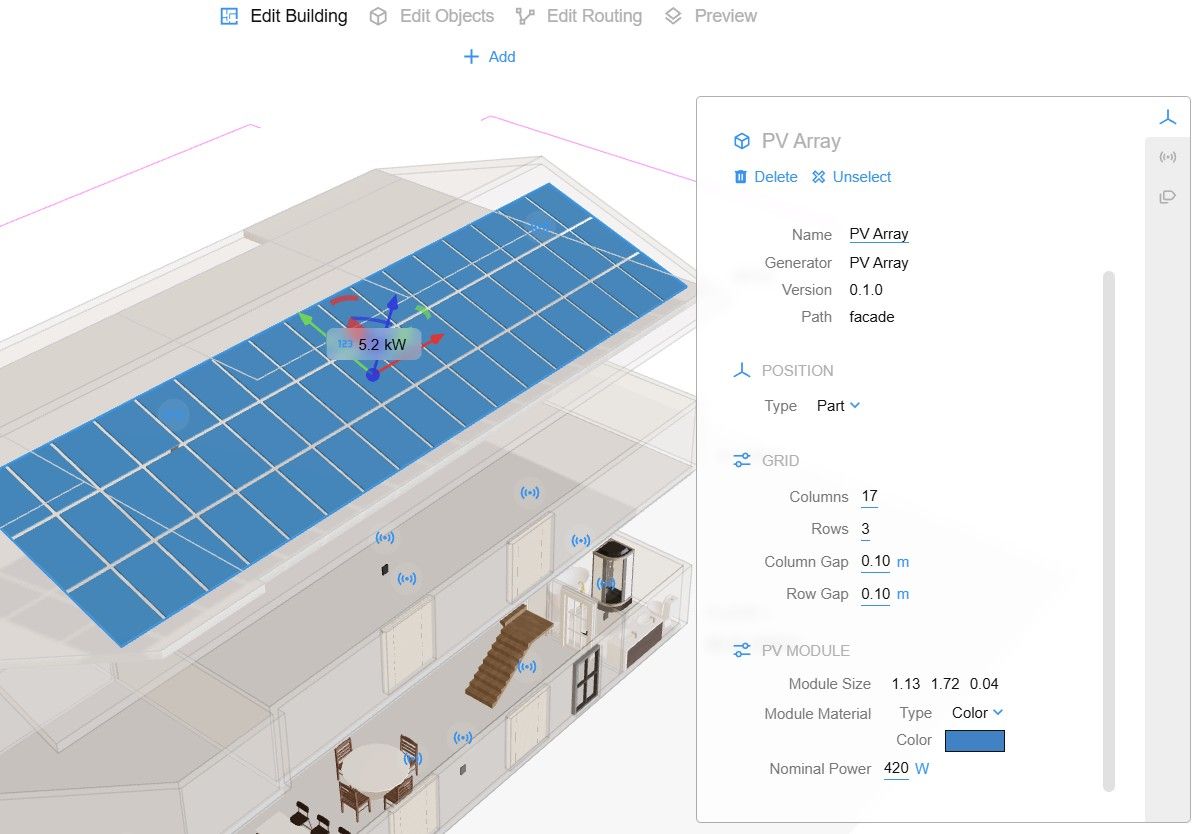
    For specialized assets, users can also upload their own .glb models. This makes it possible to add custom equipment, machinery, furniture, greenhouse components, facility assets, or other objects that are not available in the standard model library.

    Simple resizable objects can also be used as equipment blocks, platforms, partitions, cabinets, tables, storage areas, or placeholders.

    This provides two ways to build a scene:

    1. Create the building and its rooms directly in Zircon3D.
    2. Add custom GLB models for specialized equipment or visual details.

    How Sensor Data Is Mapped to the 3D Model

    One of the most important questions in a digital twin project is how to associate a sensor with the correct location or object.

    In a custom Three.js or Unity application, this normally requires manually assigning identifiers to meshes or scene objects and then writing code that updates those objects when new data arrives.

    Zircon3D uses a visual mapping workflow instead.

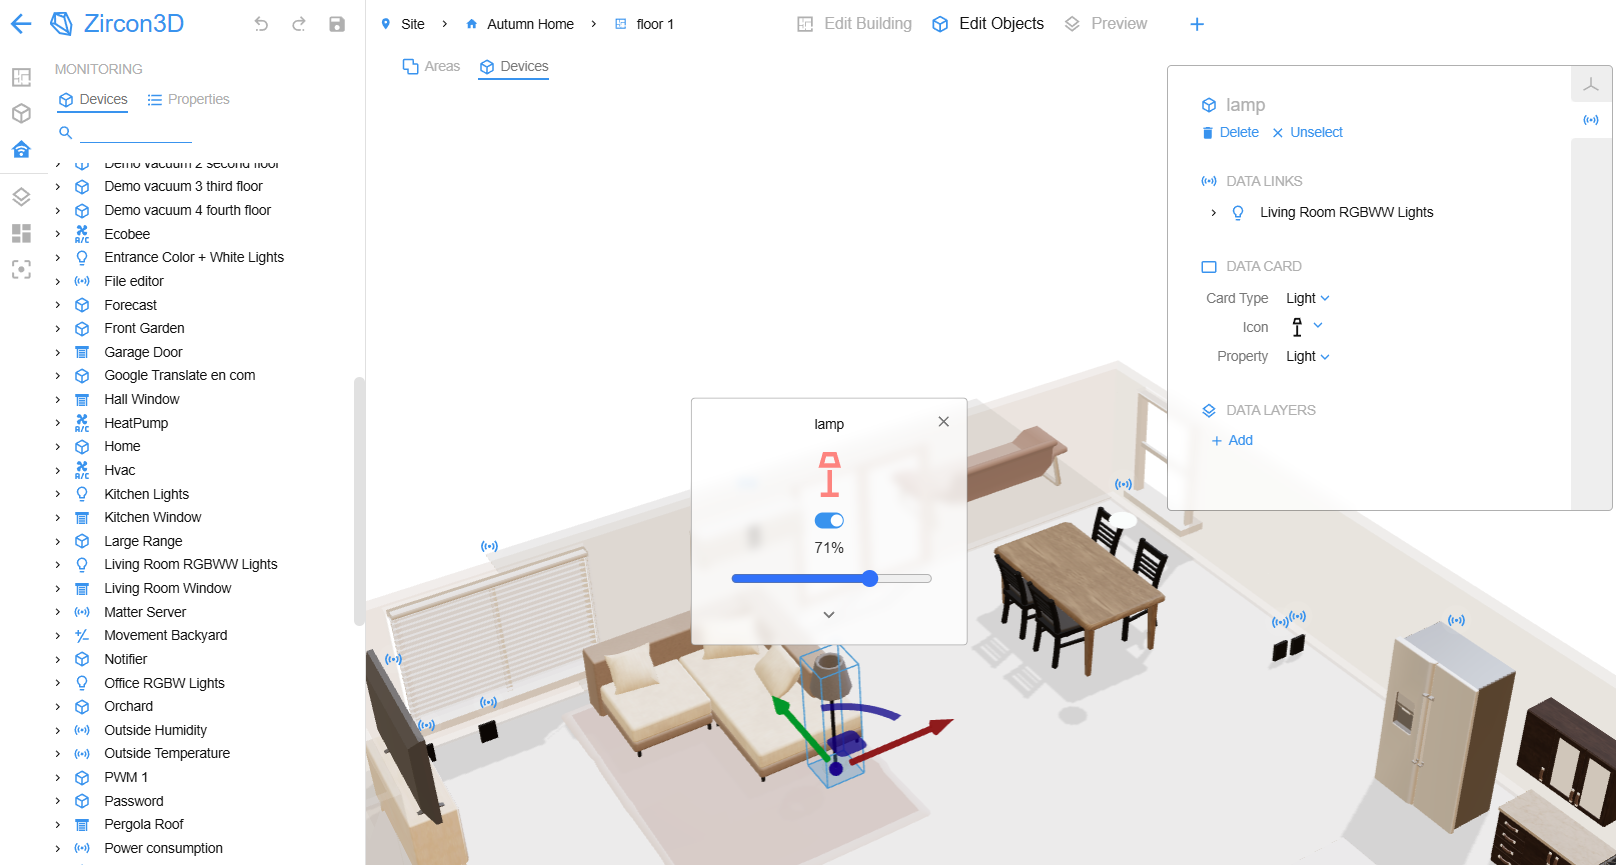
    After devices and entities are imported from Home Assistant, a user can position a monitored device at its real location inside the 3D floorplan. Its entities can then be used by different visualization components.

    For example, a temperature sensor can be:

    • Positioned in the room where it is installed.
    • Displayed through a floating information card.
    • Included in a temperature heatmap.
    • Added to a dashboard.
    • Included in a saved monitoring view.
    • Used during historical heatmap replay.

    The same approach can be used for humidity, air quality, carbon dioxide, energy, occupancy, battery level, equipment state, and other numeric or status-based entities.

    This means the relationship between the physical world and the digital model is created visually rather than through custom mesh scripting.
    6c07ccbe-2128-4d09-850c-f1739d22eedc-How-Sensor-Data-Is-Mapped-to-the-3D-Model.png

    Sensors and Home Assistant entities can be positioned visually at their real locations inside the 3D floorplan.

    Handling Real-Time IoT Sensor Data

    Zircon3D currently integrates with Home Assistant, which acts as the IoT integration and device-management layer.

    Home Assistant collects data from connected devices and exposes them as devices and entities. Zircon3D imports those entities and receives their state changes through a local proxy service.

    When a value changes in Home Assistant, the corresponding Zircon3D visualization can update automatically.

    These updates can appear in several forms:

    • A new numeric value on a floating sensor card.
    • A change in a device’s on/off state.
    • A status indicator showing that a door, window, or lock is open.
    • A changing color or pattern in a heatmap.
    • An updated dashboard gauge, value card, or chart.
    • A control card reflecting the current state of a device.

    The visualization therefore remains connected to the real environment rather than becoming a static 3D rendering.

    Can Zircon3D Visualize MQTT Sensor Data?

    Zircon3D does not currently require users to connect it directly to every individual IoT protocol.

    Instead, Home Assistant provides the integration layer.

    When an MQTT sensor is configured in Home Assistant and exposed as an entity, Zircon3D can use that entity in the same way as other Home Assistant data.

    A typical data flow can therefore look like this:

    IoT sensor → MQTT broker → Home Assistant → Zircon3D

    This separation keeps the responsibilities clear:

    • The device platform or MQTT broker transports the sensor data.
    • Home Assistant manages integrations, entities, and device states.
    • Zircon3D provides the interactive 3D visualization.

    Users do not need to create a separate MQTT-to-Three.js application simply to place live sensor values inside a building model.

    More Than Sensor Labels: Spatial Heatmaps

    Displaying a value above a sensor is useful, but it still represents only one measurement point.

    Heatmaps provide a broader understanding of how conditions change across a space.

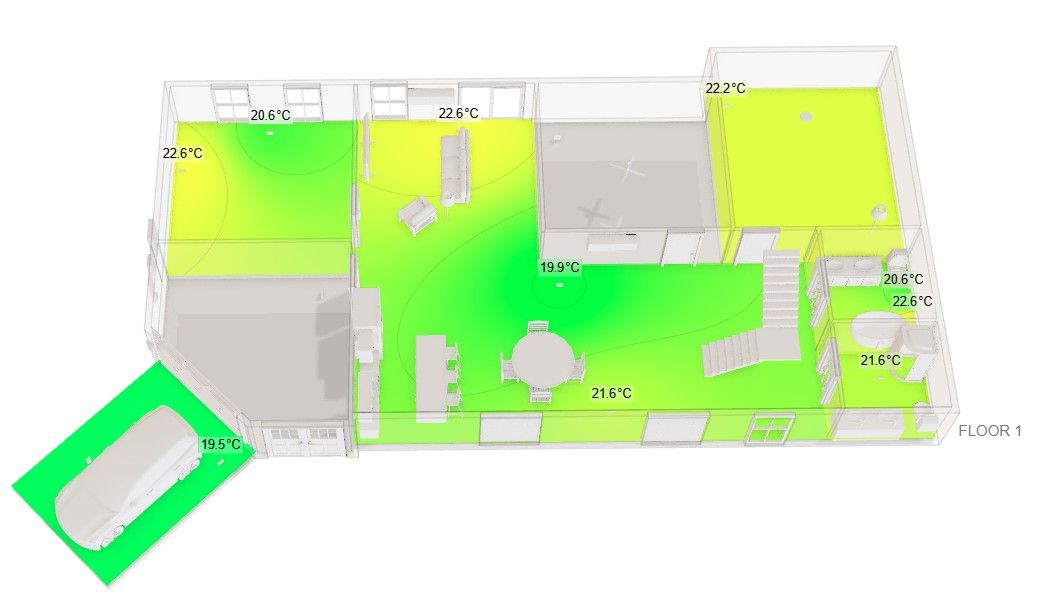
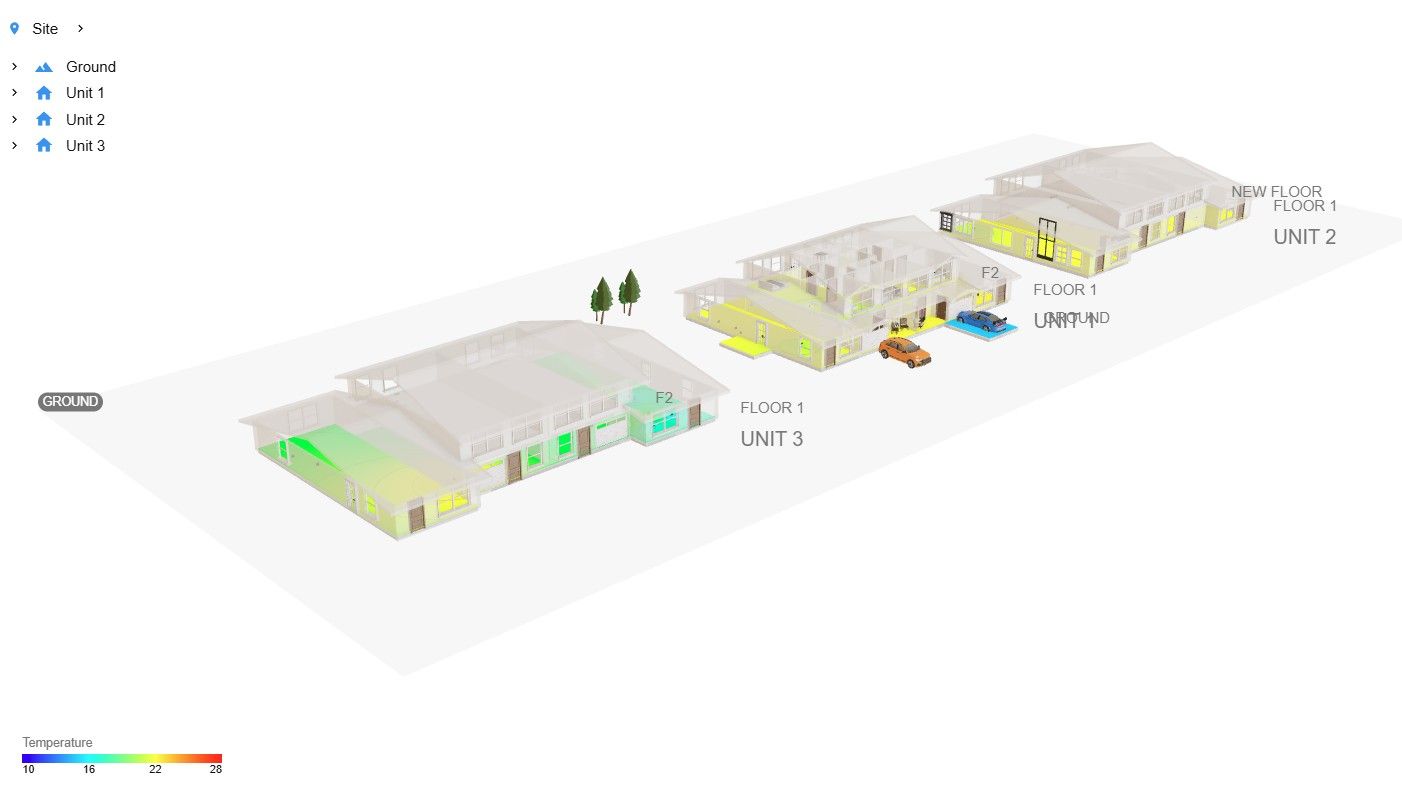
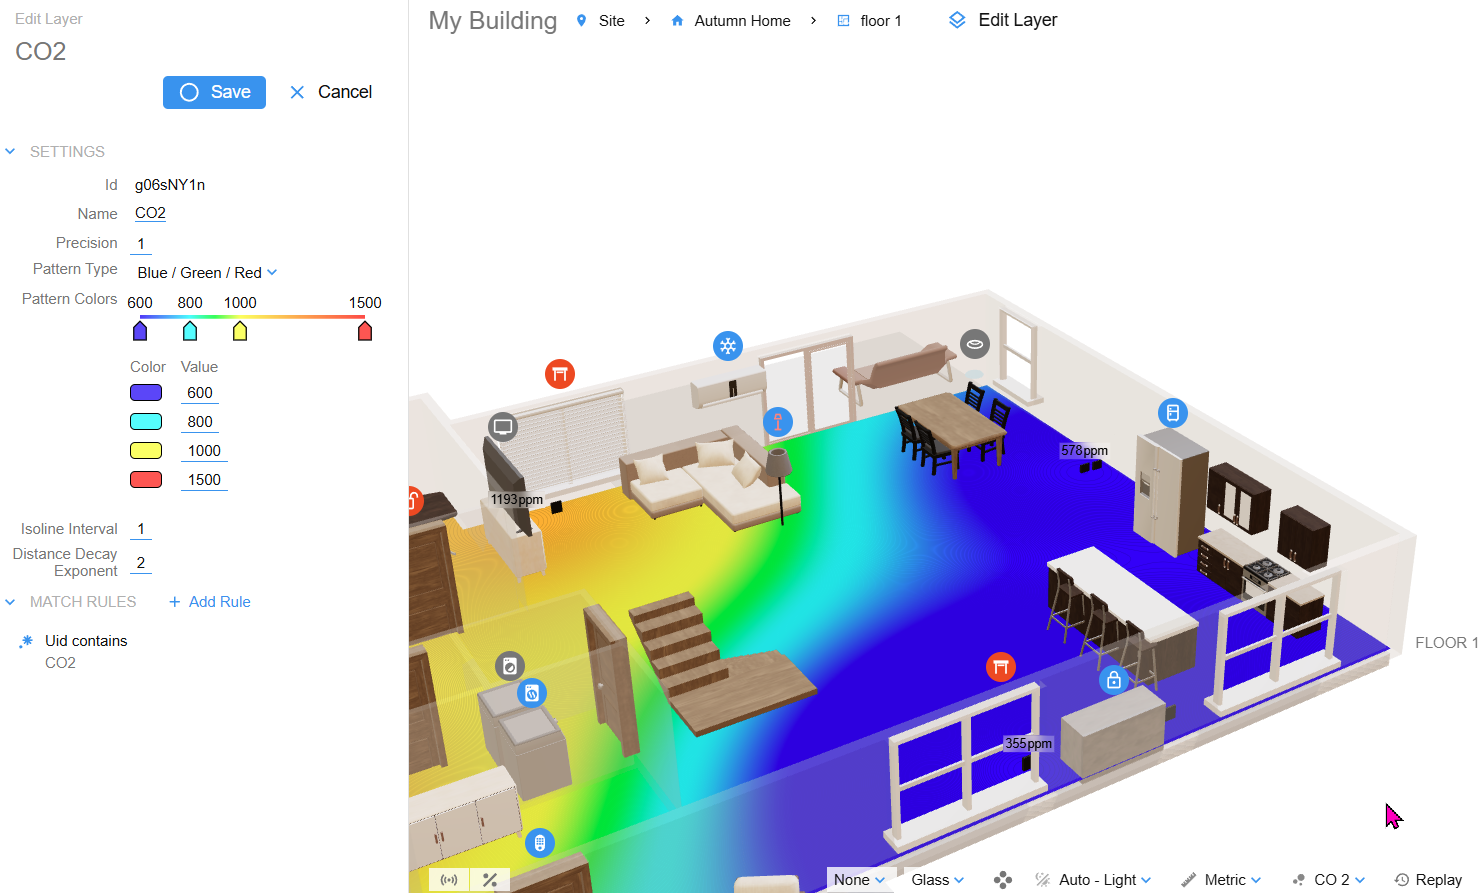
    Zircon3D can map multiple sensors into a heatmap layer and display the estimated distribution of a quantity across the floorplan.

    Common examples include:

    • Temperature distribution across rooms.
    • Humidity differences inside a greenhouse.
    • Carbon-dioxide levels in classrooms or offices.
    • Air-quality conditions across a facility.
    • Wi-Fi signal strength.
    • Custom numeric sensor measurements.

    This helps answer questions that are difficult to understand from a table:

    • Which part of the building is becoming too warm?
    • Is humidity concentrated in one greenhouse zone?
    • Are environmental conditions consistent between rooms?
    • Which area changes first when the HVAC system starts?
    • Where are additional sensors needed?

    Heatmap replay can also be used to examine how conditions changed over a selected period, adding a time dimension to the 3D IoT visualization.
    76fcb9c0-130d-4dfe-aaf6-a006cb591477-co2-heatmap.png

    Spatial heatmaps make it easier to understand how temperature, humidity, air quality, and other measurements vary across the environment.

    Combining 3D Visualization with IoT Dashboards

    Not every value is best represented directly on the model.

    A good monitoring interface combines spatial visualization with conventional dashboard components.

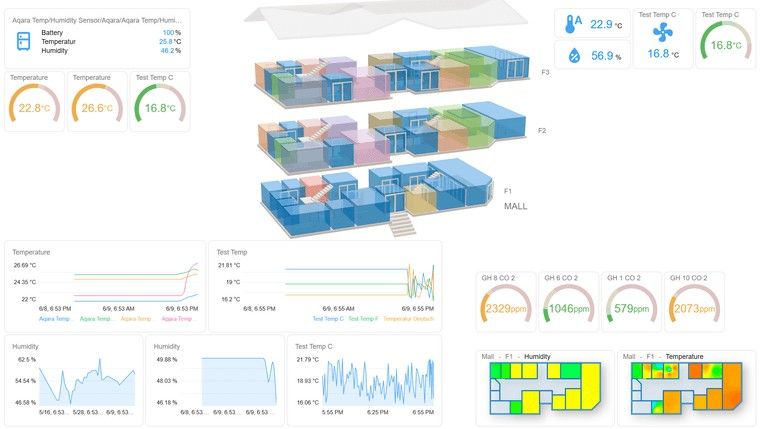
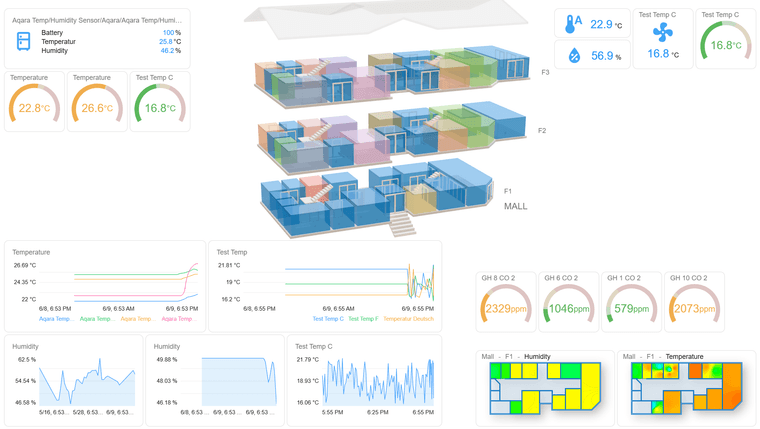
    Zircon3D allows dashboards to be displayed together with the 3D scene. A monitoring view can therefore include:

    • The interactive building model.
    • Floating sensor values.
    • Environmental heatmaps.
    • Gauges and value cards.
    • Historical charts.
    • Device status indicators.
    • Control cards.
    • Saved camera and display settings.

    The 3D model answers where something is happening, while the dashboard provides detailed values and trends.
    09c14971-9334-4879-81ae-af8955a5f166-2026-06-09 18_55_50-_Zircon3D - File Explorer.png

    The 3D model explains where an event is happening, while dashboard cards provide detailed values and trends.

    Monitoring and Controlling Connected Devices

    A digital twin does not have to be view-only.

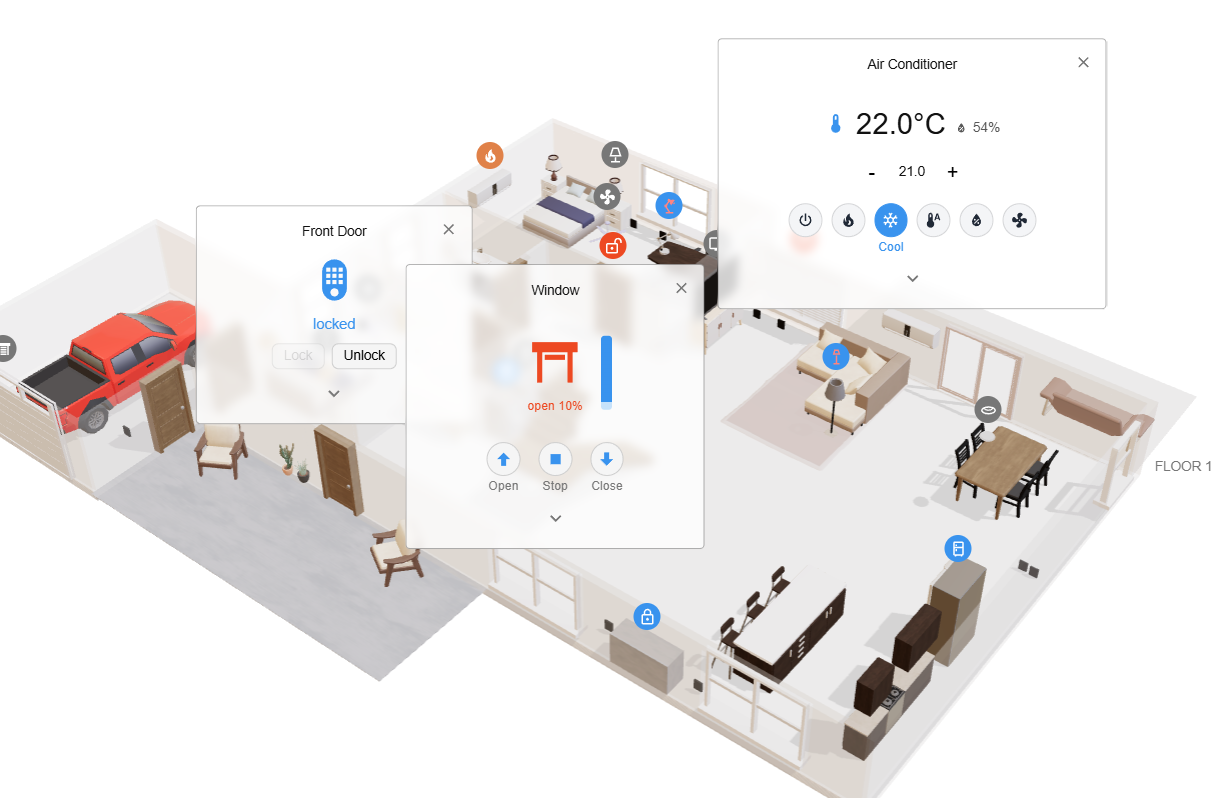
    Zircon3D supports control cards for compatible Home Assistant entities, including lights, switches, covers, climate devices, locks, and fans.

    A user can select a device in its physical location and access the relevant controls. Depending on the device, this may include:

    • Turning a light or switch on and off.
    • Adjusting light brightness or color.
    • Opening or closing a cover.
    • Changing a thermostat setting.
    • Controlling a fan.
    • Locking or unlocking a supported lock entity.

    Commands are sent through Home Assistant rather than directly from Zircon3D to the physical device.

    This allows Zircon3D to remain a visualization and interaction layer while Home Assistant continues to manage device communication and automation.
    1ecb3820-dbbf-4294-8409-17dfb8c00e4d-smart-control.png

    Supported Home Assistant devices can be monitored and controlled from their physical locations in the 3D model.

    Local-First IoT Data and Privacy

    Privacy is an important consideration for smart buildings and digital twins.

    When Zircon3D is installed through the Home Assistant add-on or Docker service, communication with Home Assistant occurs locally.

    Sensor readings, device states, and locally stored monitoring history remain on the user’s own system. Zircon3D Cloud is used for account and license management rather than storing live Home Assistant monitoring data.

    This local-first architecture can be useful for:

    • Private homes.
    • Schools and educational projects.
    • Small businesses.
    • Farms and greenhouses.
    • Laboratories.
    • Facilities with sensitive operational data.
    • Installations with limited internet connectivity.

    The visualization can continue to operate as part of the local environment without sending every sensor update to an external IoT visualization service.

    What Zircon3D Is and What It Is Not

    Zircon3D is best suited to spatial monitoring and interaction.

    It can show where sensors and devices are located, visualize their current values, present environmental heatmaps, display historical information, and provide supported device controls.

    It is not intended to replace specialized engineering tools for:

    • Finite-element analysis.
    • Structural deformation simulation.
    • Computational fluid dynamics.
    • Mechanical stress analysis.
    • Physics-based equipment simulation.
    • Predictive engineering models.

    For a digital twin that must simulate how pressure physically deforms a machine component, specialized engineering software or a custom application may still be required.

    For a digital twin that needs to show the current pressure, temperature, position, alarm state, or operating condition of equipment inside a building or facility, Zircon3D can provide the visualization layer without requiring a new application to be developed from scratch.

    A Practical Workflow for Building a 3D IoT Visualization

    A basic Zircon3D project can follow this process:

    1. Connect sensors to Home Assistant

    Configure the IoT devices and confirm that their values appear as Home Assistant entities.

    2. Create the building or facility layout

    Use Zircon3D Designer to create floors, rooms, walls, doors, windows, and important physical areas.

    3. Add equipment and custom models

    Use built-in objects, resizable simple objects, or uploaded GLB models to represent important equipment and assets.

    4. Position monitored devices

    Place each sensor or device at the location that corresponds to its installation in the real environment.

    5. Map the sensor data

    Display the entities through floating cards, dashboards, heatmap layers, status indicators, or saved monitoring views.

    6. Create operational views

    Save different camera positions and visualization settings for purposes such as environmental monitoring, security, energy, equipment status, or executive overview.

    7. Display the visualization

    Open Zircon3D directly or embed a saved view inside a Home Assistant dashboard.

    This process creates a practical digital twin without requiring users to build their own 3D engine, WebSocket service, device-mapping database, and visualization interface.

    Frequently Asked Questions

    Do I need Three.js or Unity to build a 3D IoT dashboard?

    Not necessarily. These tools are useful for completely custom applications, but Zircon3D provides a ready-made 3D visualization environment for buildings, rooms, sensors, and Home Assistant entities.

    Can I use a model created in Blender?

    Yes. Custom assets can be exported from Blender in GLB format and uploaded to Zircon3D. The building layout can also be created directly with the Zircon3D Designer.

    How do I connect a sensor to a specific location?

    Import the sensor entity from Home Assistant, mount the monitored device in the 3D floorplan, and position it at the corresponding physical location. Its values can then be shown through cards, heatmaps, dashboards, and monitoring views.

    Does Zircon3D support real-time sensor updates?

    Yes. Changes received from Home Assistant can automatically update the 3D view, sensor cards, dashboards, and heatmaps.

    Can it visualize MQTT data?

    Yes, when the MQTT sensor or device is configured as an entity in Home Assistant. Zircon3D uses the entity exposed by Home Assistant rather than connecting separately to the MQTT broker.

    Does it require a cloud IoT platform?

    No external cloud IoT platform is required for Home Assistant monitoring. The Zircon3D proxy can run locally as a Home Assistant add-on or Docker service, and monitoring data stays within the local environment.

    Is Zircon3D only for smart homes?

    No. The same approach can be used for greenhouses, farms, offices, schools, laboratories, workshops, equipment rooms, and small or medium-sized facilities.

    A More Accessible Approach to 3D IoT Visualization

    Building a digital twin no longer has to begin with selecting a game engine and creating an entire custom software stack.

    When the objective is to visualize real-time sensor data in its physical context, Zircon3D provides a more direct approach:

    • Create an interactive 3D building model.
    • Position sensors and devices in their real locations.
    • Connect live Home Assistant entities.
    • Display values, states, dashboards, and heatmaps.
    • Review historical environmental changes.
    • Control supported devices.
    • Keep monitoring data local.

    The result is a practical 3D IoT visualization that connects the digital model with the real environment while reducing the development work normally required.

    Explore Zircon3D, read the documentation, or join the Zircon3D community to learn more.
    Blog & Highlights

  • Zircon3D Roadmap - What’s Next
    Tami LiuT Tami Liu

    This post shares our current development direction after the Zircon3D v2.2 release.

    Current Focus: Routing System

    After v2.2, our next development focus will be the routing system.

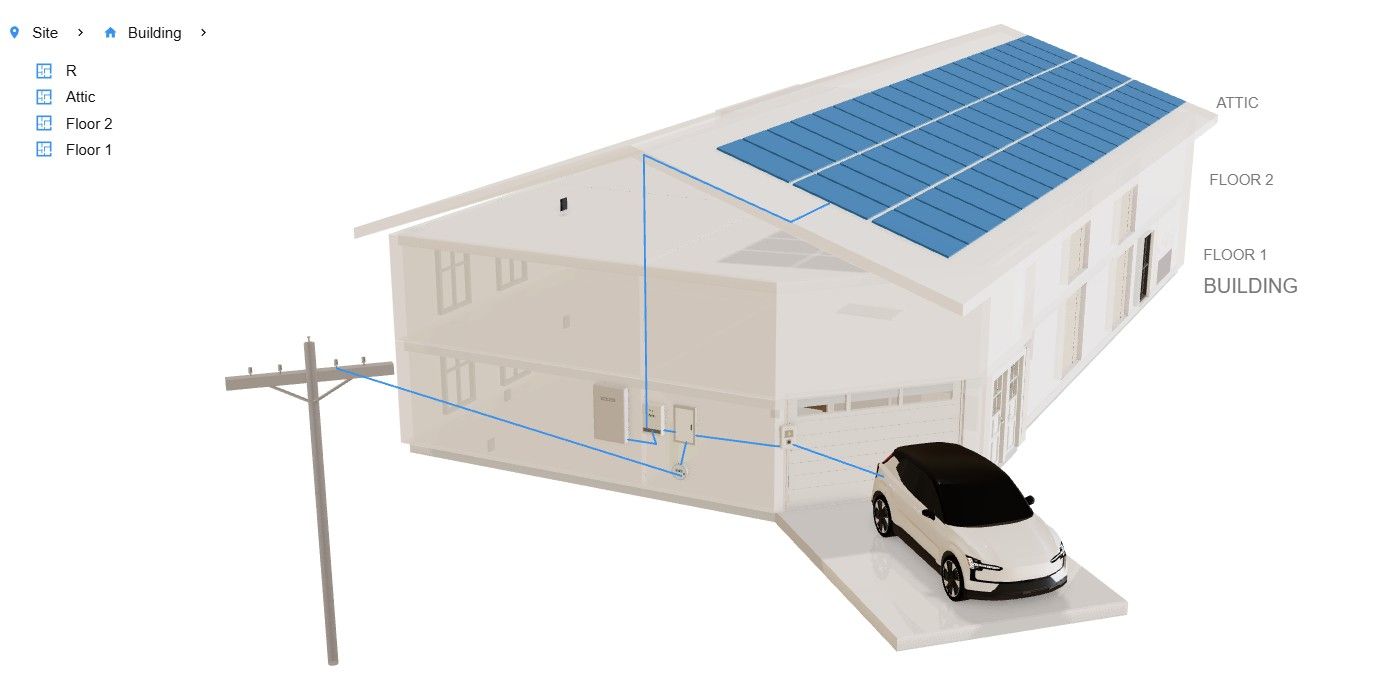
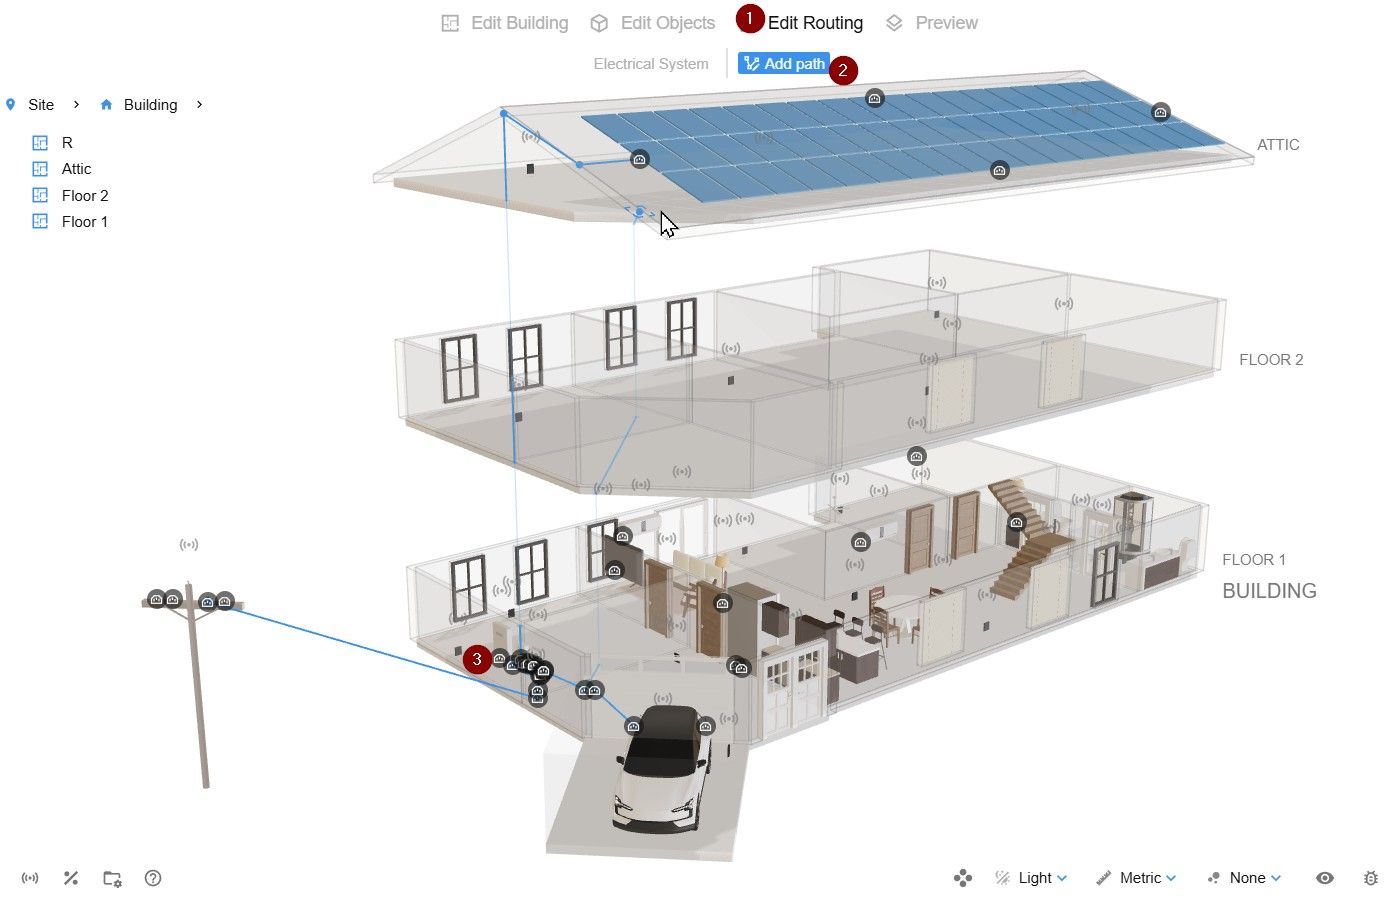
    The idea is to make Zircon3D able to visualize connected systems inside or around a building, such as Energy systems, solar panels, home batteries, EV chargers, main panels and inverters, water pipes, sewer lines, greenhouse irrigation systems, HVAC ducting or airflow paths, and other routing-style systems in the future.

    The goal is to make complex building data easier to understand visually from a 3D layout, showing where things are, how they are connected, and how data or resources flow through the system.

    8c2a612c-1c6d-461f-ab7b-14074e79b1e8-2026-05-15 12_29_25-Sticky Notes (new).png

    Visual Enhancement

    2026-05-14 19_16_54-tmp - File Explorer.png

    Dashboard Enhancement

    2026-06-09 19_03_48-_Zircon3D - File Explorer.png

    Seasonal Plan

    Features actively in development or planned for the next seasonal releases, typically within the next 2–4 months.

    Current: 2026-S2

    • Routing System - Draw and visualize connected routes such as energy lines, wires, pipes, ducts, or irrigation paths in 3D.
    • Static Floating Card - Display static text, labels, notes, or images above objects in the 3D view.
    • Template System - Create reusable templates for buildings, floors, rooms, or groups of objects.
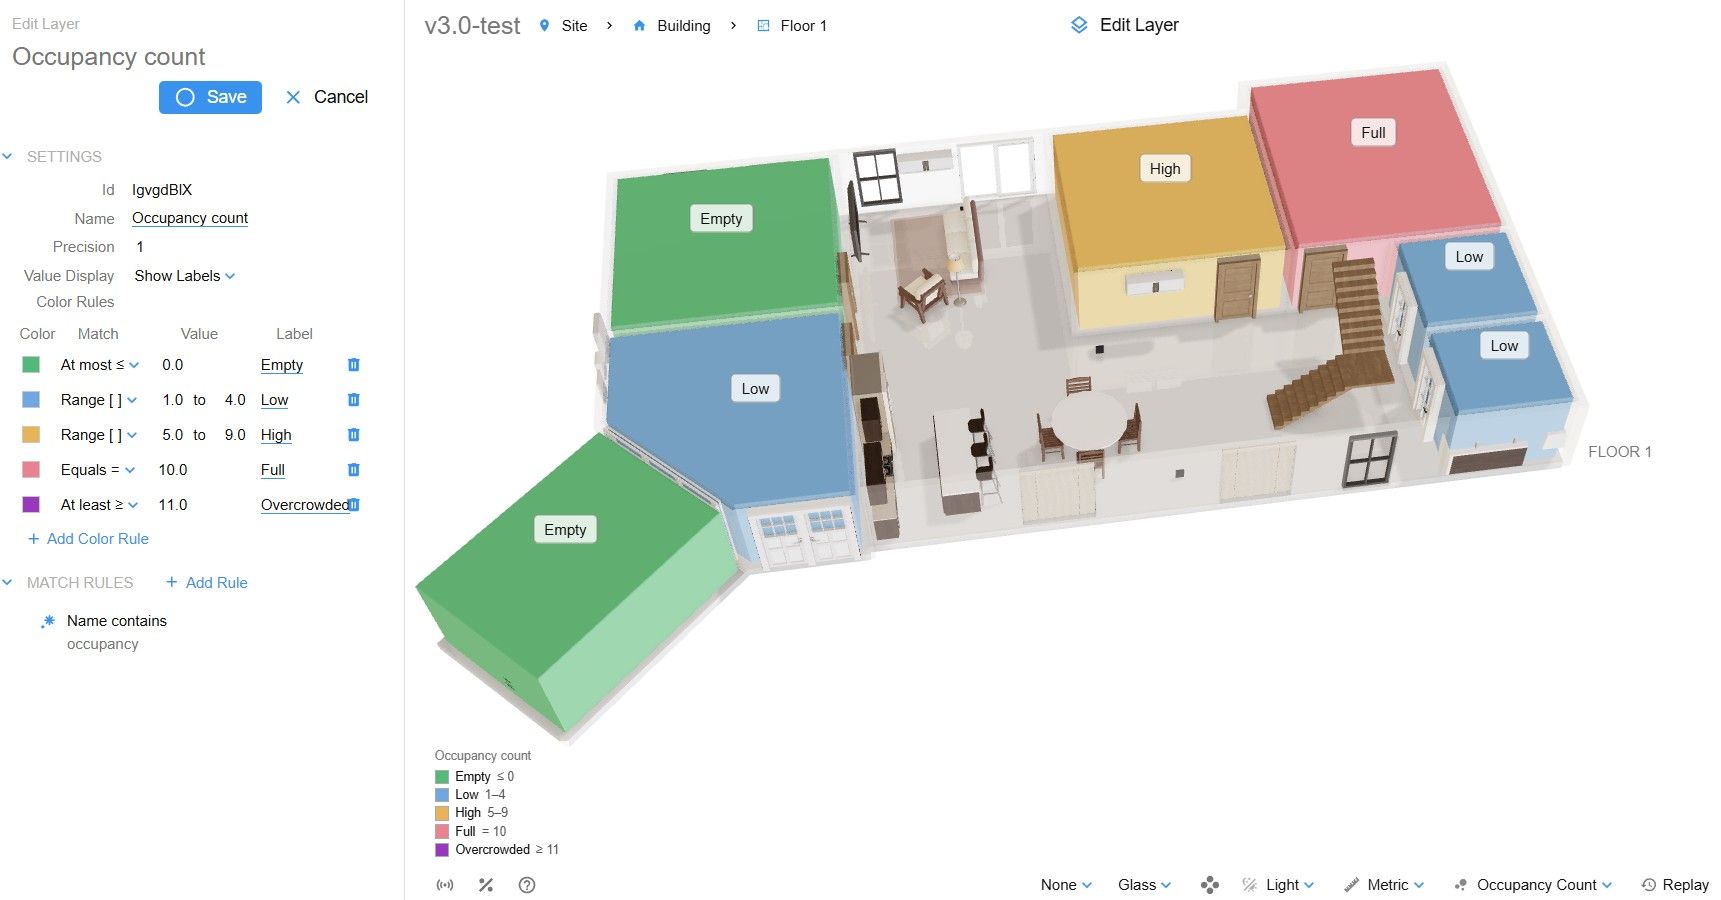
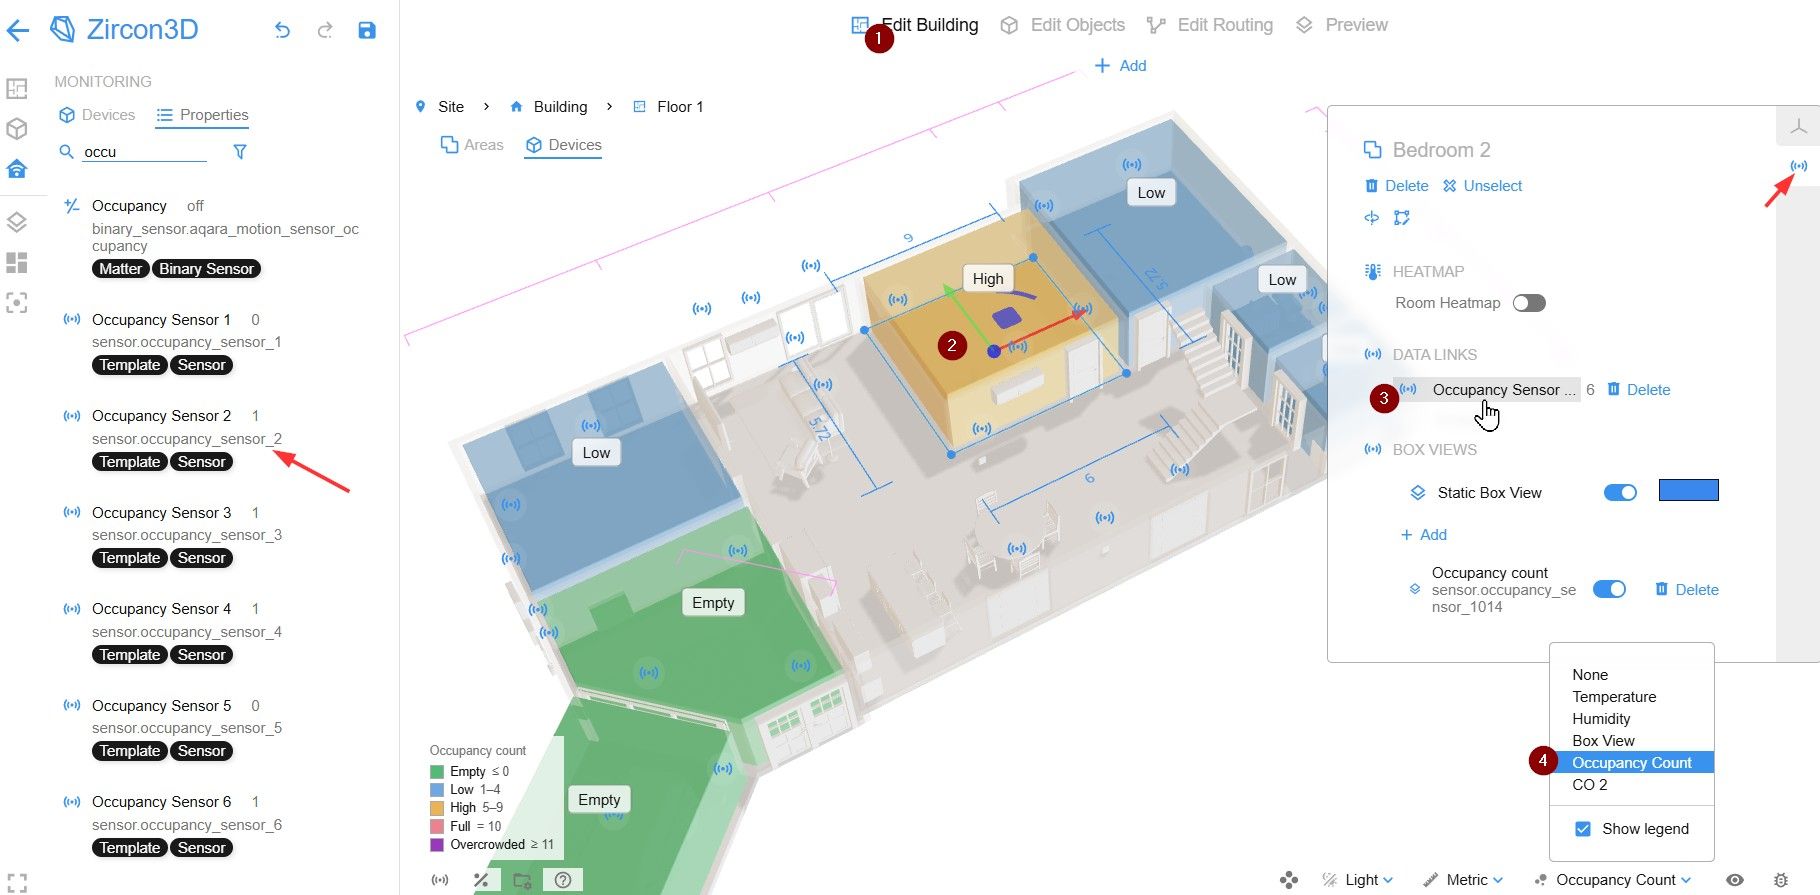
    • Room Box View with Sensor Data - Allow room colors to represent values such as occupancy, air quality, or other sensor data.
    • Copy and Paste - Clone objects more easily using shortcut keys or pointer-based actions.
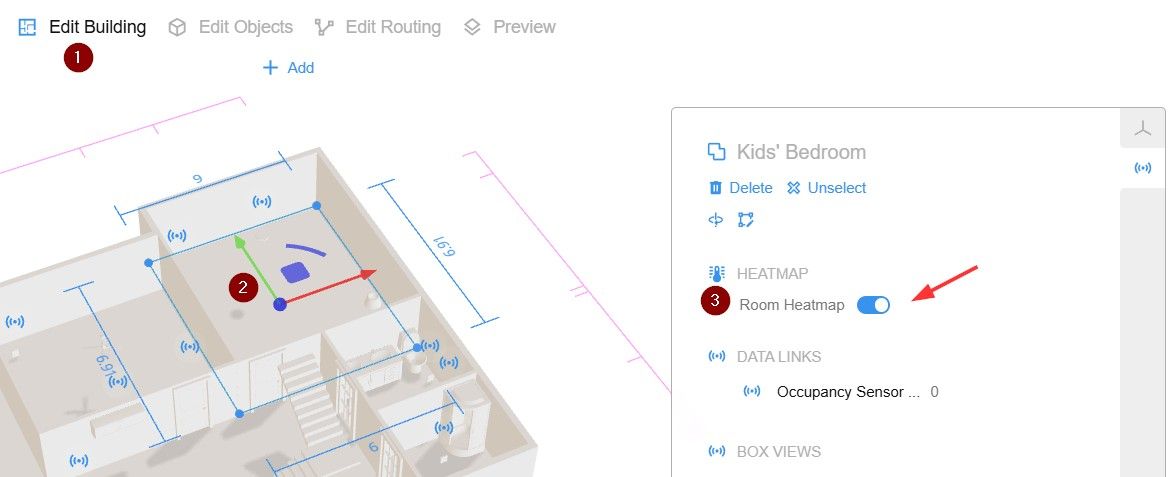
    • More Usability Improvements - Continue improving editing workflow, object placement, visual controls, and general usability.

    Suggest a Feature

    We’d love to hear your ideas and feedback.
    If there are features you’d like to see in Zircon3D, please share them in our forum
    Your suggestions help us understand real use cases and prioritize future improvements.

    Notes

    Items listed in this roadmap are directional and not guaranteed commitments. Priorities may change based on technical progress, user feedback, and real-world use cases.

    Announcements & Updates roadmap

  • Zircon3D v2.2 — Upload Custom Models, Simple Objects, More Control Cards, and Room Box View
    Tami LiuT Tami Liu

    Patch Update: Zircon3D v2.2.1 — 2026-05-15

    We released a small patch update for Zircon3D v2.2.

    New Feature

    • Added Project Tools: support exporting and importing Zircon3D space-plan / floorplan data.

    Bug Fixes

    • Fixed an issue where switching edit mode did not reset Box View correctly.
    • Fixed behavior issues related to View Settings, Floating Cards, and Sensor Card Display.

    The new import/export feature can be useful when you need to move, back up, or share a floorplan between Zircon3D projects.

    How to import/export a floorplan in Zircon3D

    This feature is only for exporting floorplan data from Zircon3D and importing it back into Zircon3D. It is not for importing files from other design systems.

    1. Open Zircon3D in Home Assistant.
    2. Select your project, then click Edit to open the Designer.
    3. In the bottom-left bar, open Project Tools.
    4. Choose Import Project or Export Project.
    5. When importing, select the project file exported from Zircon3D.
    6. After importing, click Save to keep the imported floorplan, or press Undo to discard the changes.
    Announcements & Updates release-note

  • Is Zircon3D Open Source?
    Tami LiuT Tami Liu

    No. Zircon3D is not open source / FOSS.

    Zircon3D is a commercial product developed by Lichr Inc. We provide a Free plan for general home users, but the main Zircon3D application source code is not open source.

    What is public?

    Some installation-related resources are public, such as the Home Assistant add-on repository and setup instructions. These are provided so users can install and run Zircon3D with Home Assistant.

    You can find the documentation here:
    https://zircon3d.com/docs

    What is not open source?

    The main Zircon3D application source code, including the 3D Designer, Viewer, rendering system, device mapping logic, and related product features, is not open source.

    Can I use Zircon3D for free?

    Yes. Zircon3D has a Free plan for home users. Paid Home and Business plans are available for users who need more monitoring devices, advanced visualization features, or larger/commercial use cases.

    Why is Zircon3D not open source?

    Zircon3D is built and maintained as a commercial product. Keeping the main application closed-source helps us continue development, provide support, improve the product, and build long-term sustainability.

    We understand that some users prefer open-source solutions, and we respect that. For users who are comfortable with a commercial product that includes a Free plan, Zircon3D is available to try with Home Assistant.

    Tutorials & FAQ

  • Zircon3D v2.2 — Upload Custom Models, Simple Objects, More Control Cards, and Room Box View
    Tami LiuT Tami Liu

    We’re excited to introduce Zircon3D v2.2, a feature-rich update focused on making 3D building visualization more flexible, interactive, and useful for real-world smart home and facility scenarios.

    Watch the v2.2 release video here:
    f8dd2dde-ec2b-40cb-8e6e-c9c576fc3501-image.png

    This release adds support for custom GLB models, editable simple cube objects, more smart device control cards, room-level Box View styling, multiple selection, and many bug fixes and performance improvements.

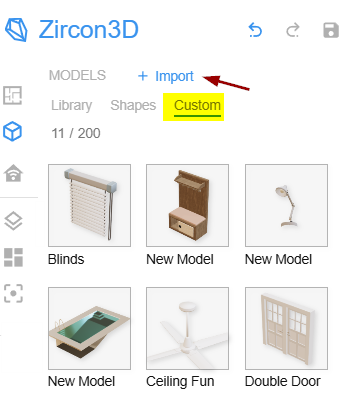
    Custom Models: Upload Your Own .glb Models

    You can now import your own .glb 3D models into Zircon3D.

    This makes it possible to add custom furniture, equipment, machines, facility assets, or any other 3D model that better represents your real space.

    This is especially useful when the built-in model library is not enough for your specific project.

    4c3ee6b9-db30-4f04-ae48-b7a32e0b0f6a-image.png

    Simple Cube Object

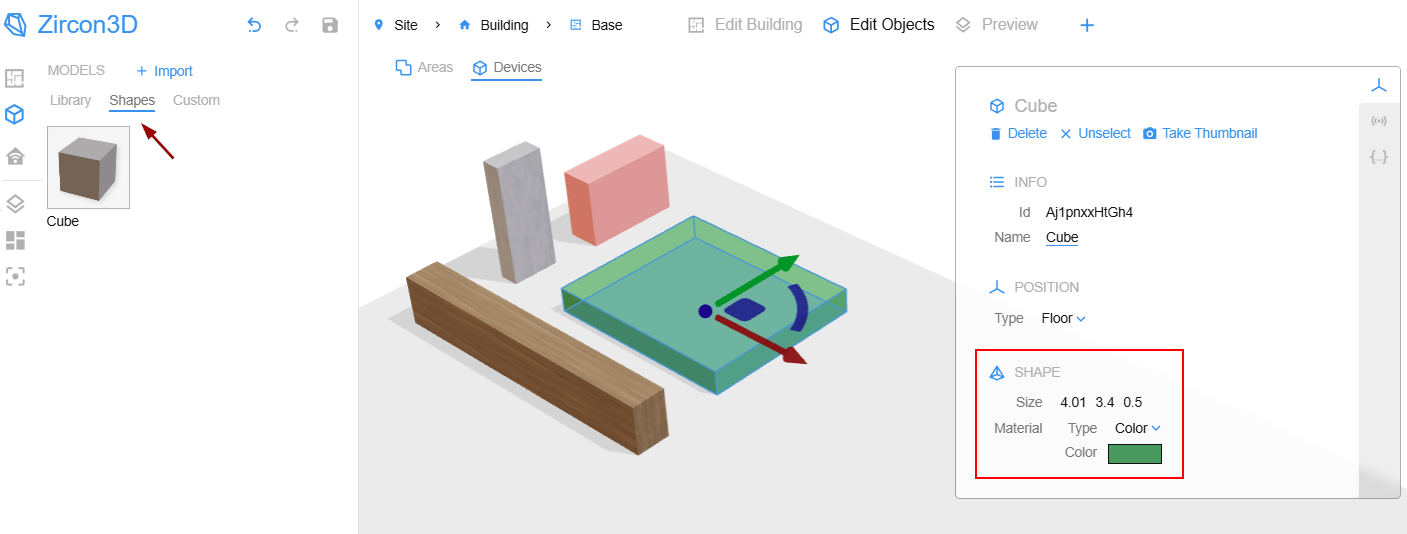
    We added a new Simple Cube Object.

    This object is very flexible: you can edit its:

    • Width
    • Depth
    • Height
    • Color or material

    Even though it starts as a simple cube/block, it can be resized into many useful forms, such as a table, platform, partition, box, equipment block, parking area, raised base, or simple placeholder object.

    It is a small feature, but very practical for quickly building custom scenes.

    d7f832bf-d6fc-4cd4-ab31-099cdfaa4b24-image.png

    More Smart Device Control Cards

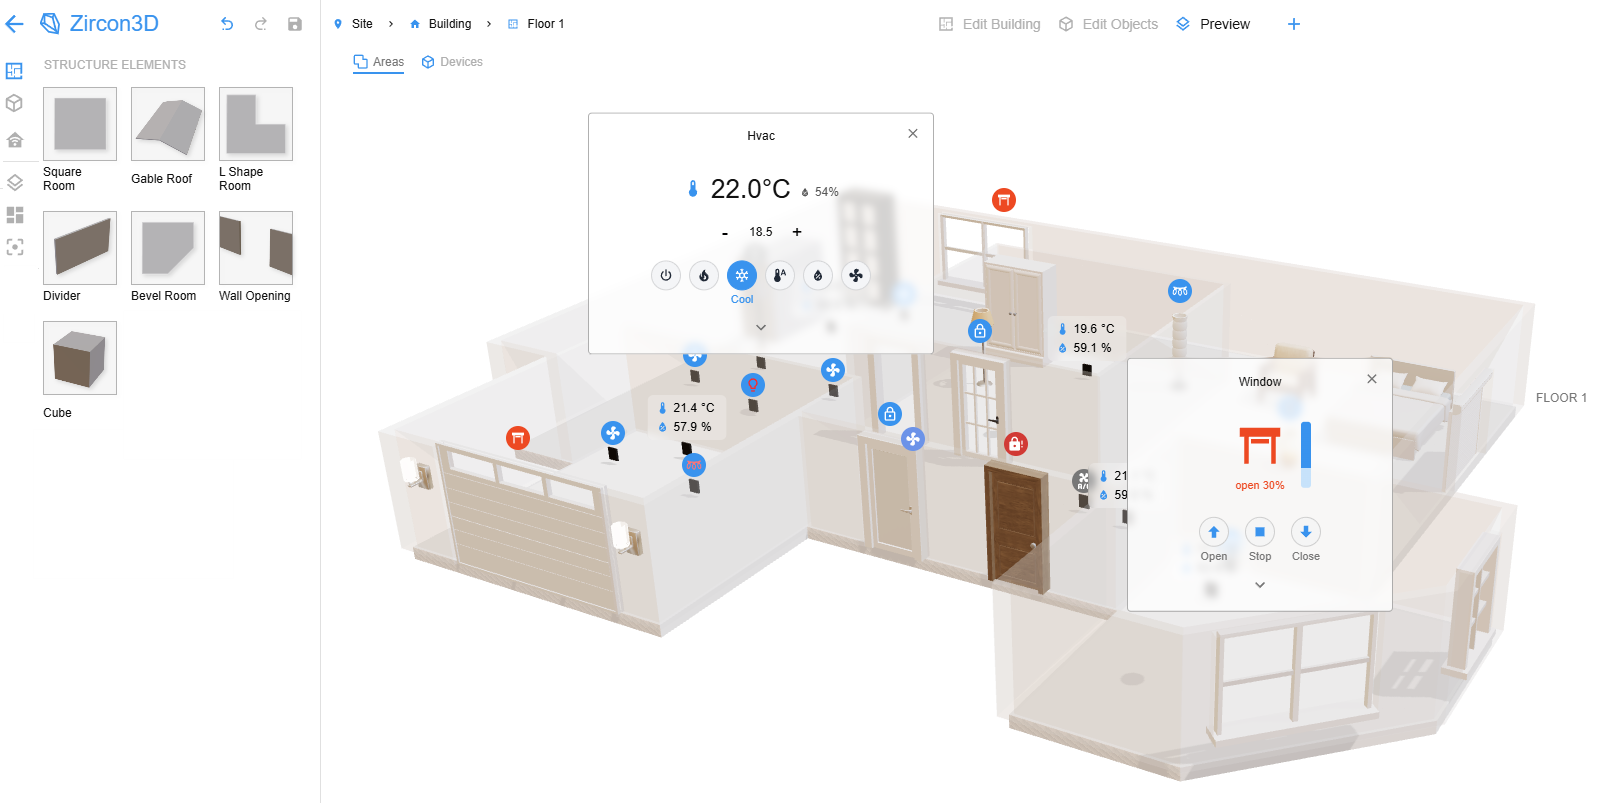
    Zircon3D v2.2 adds more interactive control cards for Home Assistant entities.

    The enhanced control cards include:

    Light Card - Supports brightness percentage and color control.

    Cover Card - For garage doors, windows, shades, blinds, curtains, and other cover entities.

    Climate Card - For air conditioners, heat pumps, thermostats, and similar climate devices.

    Lock Card - For door locks and other lock entities.

    Fan Card - For fan entities, with related controls.

    These cards make Zircon3D not only a 3D visualization interface, but also a more convenient 3D control layer for your smart home.

    a9f61d20-65f2-43d4-b064-b59d6291221e-image.png

    Status Bubbles on the Floorplan
    Control cards also show clear colored status bubbles directly on the floorplan. This makes important states much easier to notice at a glance, such as when a window is open, a garage door is open, or a door is unlocked.

    This provides a more intuitive way to understand the real status of your home or building directly from the 3D view.

    Room Box View

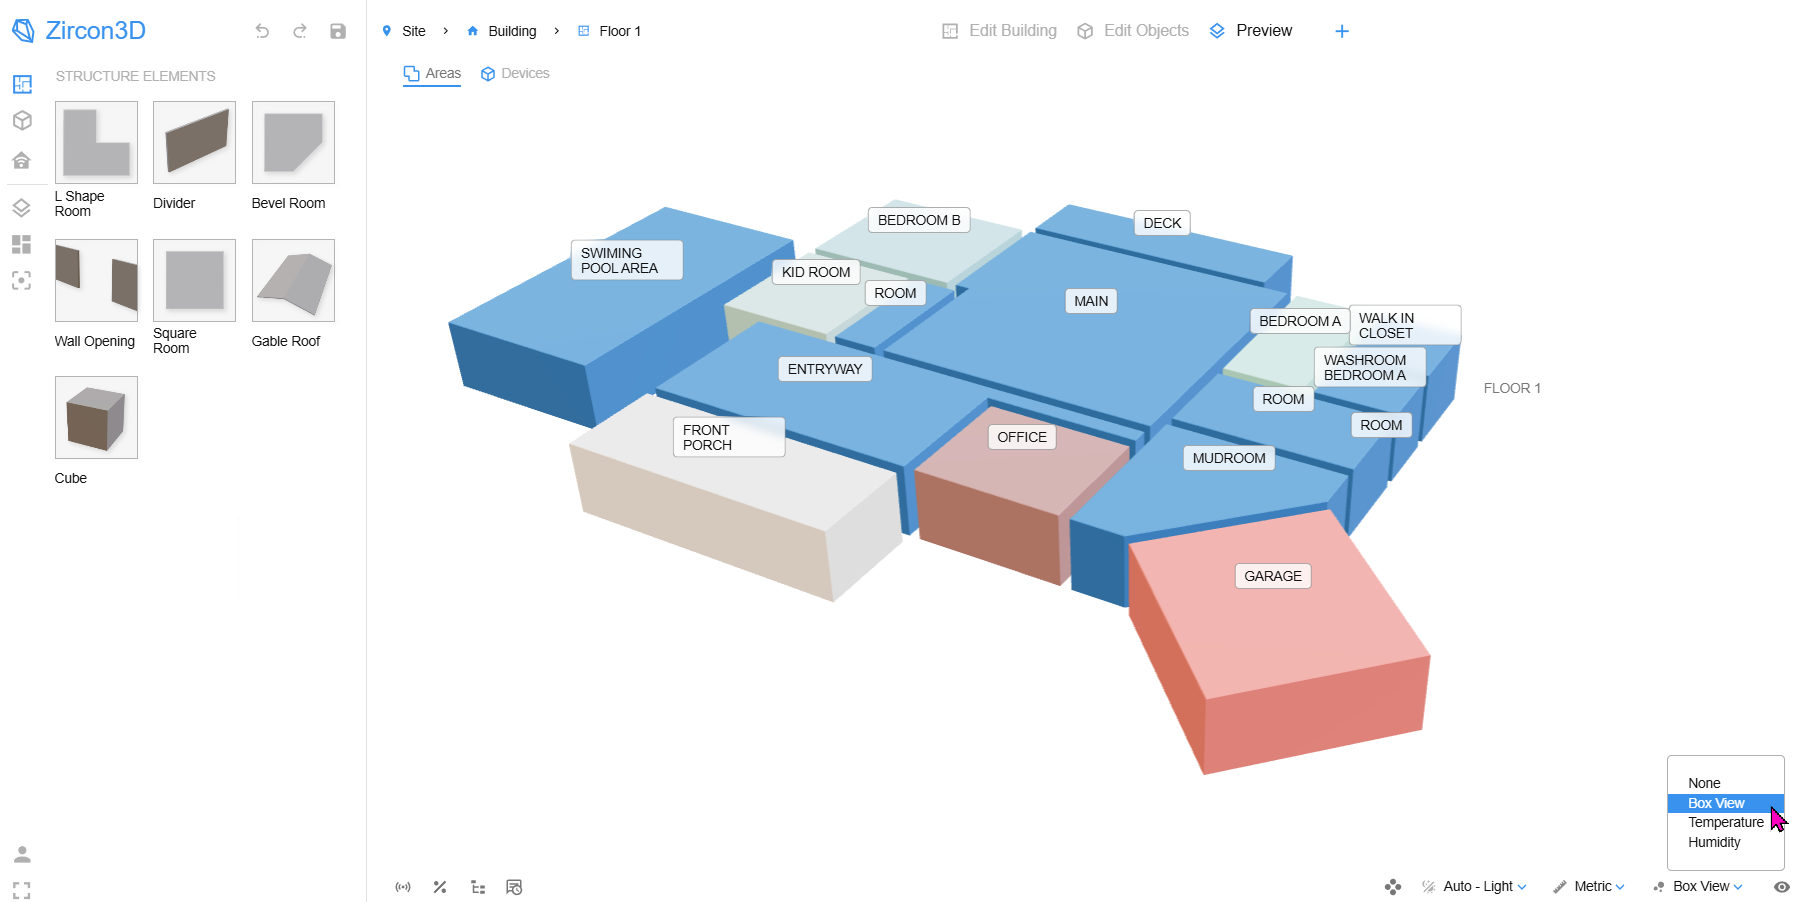
    We added Box View support at the room level.

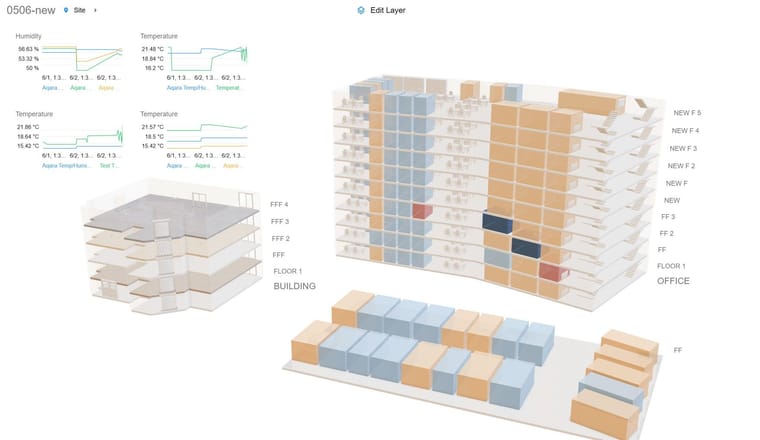
    You can now show rooms as colored box-style blocks and assign colors to different rooms. This provides a cleaner and more abstract way to understand room layout, zones, or functional areas.

    In the next version, we plan to extend this feature so the room Box View can be mapped to monitoring sensor data, allowing rooms to be colored dynamically based on real-time values. For example room occupancy or other sensor data.

    796779a0-e5cf-47db-aa00-1df31981f9c6-image.png

    Multiple Selection

    You can now select multiple objects or rooms by holding the Ctrl key.

    This allows you to move or delete multiple items at once, making editing much faster and more convenient when working with larger floorplans.

    Bug Fixes and Performance Improvements

    This release also includes many bug fixes and performance improvements across the Designer and Viewer.

    We continue to improve stability, usability, and the overall editing experience as Zircon3D grows into a more powerful 3D visualization platform.

    Try Zircon3D v2.2

    Thank you to everyone who continues to test Zircon3D, share feedback, and help us improve the product.

    Get started with Zircon3D: https://zircon3d.com
    Documentation: https://zircon3d.com/docs
    Community forum: https://forum.zircon3d.com
    YouTube tutorials: https://www.youtube.com/@Zircon3D
    Facebook group: https://www.facebook.com/groups/zircon3d

    Announcements & Updates release-note

  • Why do I see a 401 Unauthorized error or a blank Zircon3D dashboard in Home Assistant?
    Tami LiuT Tami Liu

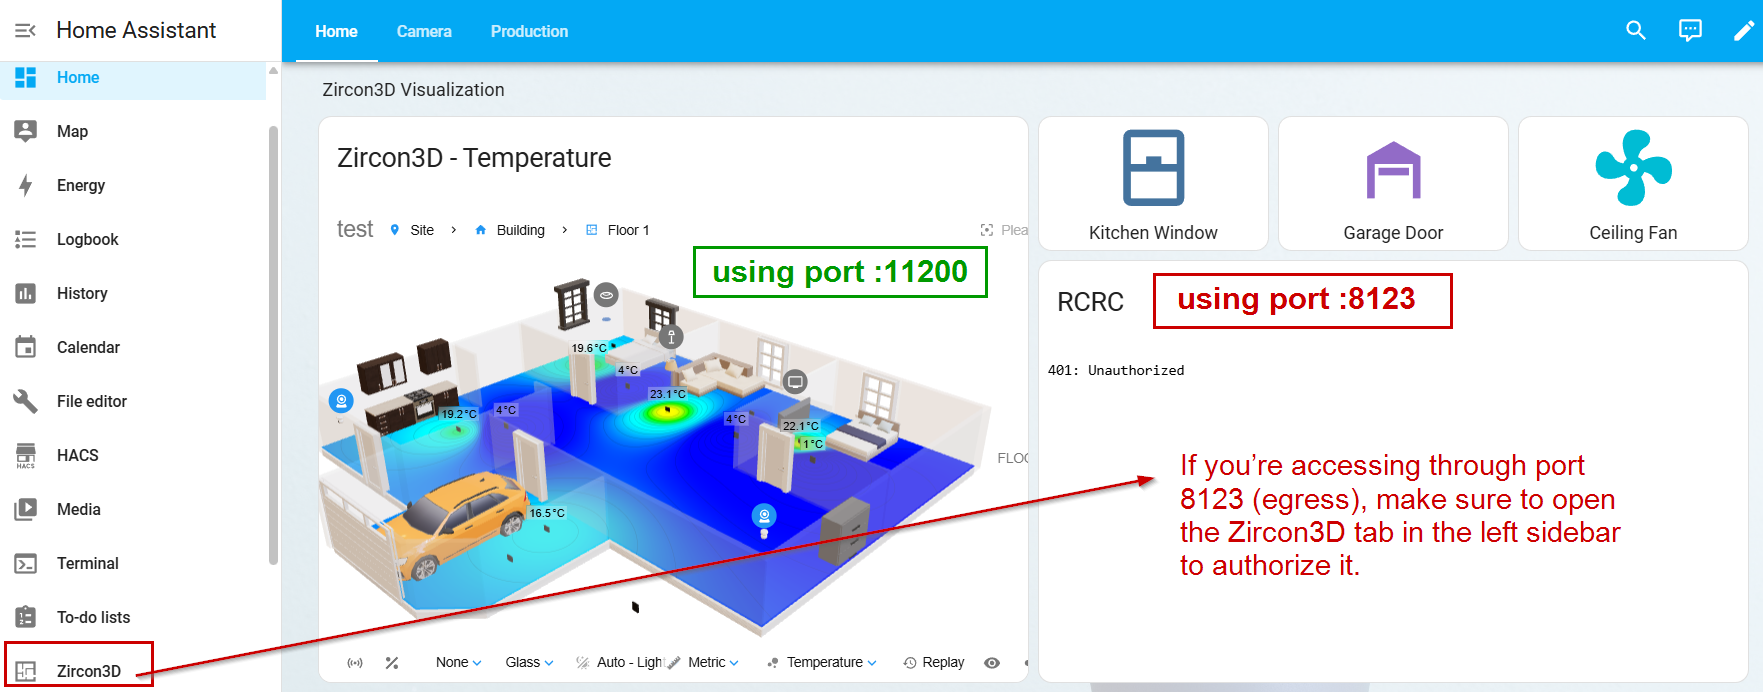
    This usually happens due to a Home Assistant ingress authorization issue.

    Related: https://forum.zircon3d.com/topic/6/

    How to fix it

    You have two options:

    Option 1 (Recommended)
    Use port :11200 to access Zircon3D directly.

    • Open Zircon3D via http://<your-ha-ip>:11200
    • Copy and use the view link from there
    • This avoids the ingress issue entirely

    Option 2 (Using default HA port 8123)
    If you’re accessing through port 8123, you need to authorize Zircon3D first:

    • Open Home Assistant
    • Click the Zircon3D tab in the left sidebar
    • Then reload your dashboard/view

    69cbdaf9-b5e5-4231-bf62-0f1d9b42fbe7-image.png

    Why this happens

    Home Assistant only initializes ingress access after the add-on UI is opened once. If you try to load an embedded Zircon3D view before that, it may return a 401 Unauthorized error.


    If the issue persists, feel free to reach out with details about your setup

    Tutorials & FAQ

  • How to Create a Heatmap with Custom (Pre-Processed) Data in Zircon3D
    Tami LiuT Tami Liu

    Zircon3D allows you to visualize not only raw sensor data, but also custom computed values using tools like Home Assistant template sensors.

    This guide shows how to create a Temperature Delta heatmap, but the same approach works for any custom metric.


    What is “Pre-Processed Data”?

    Pre-processed data means:

    Data that is calculated or transformed before visualization

    Examples:

    • Temperature Delta (current vs target)
    • VPD (humidity + temperature)
    • Energy efficiency metrics
    • Custom scoring or alerts

    Step 1 Create a Template Sensor

    In Home Assistant:

    template:
      - sensor:
          - name: "Living Room Temperature Delta"
            unique_id: "living_room_temperature_delta"
            unit_of_measurement: "°C"
            state: >
              {{ (
                  state_attr('climate.living_room', 'current_temperature')
                  - state_attr('climate.living_room', 'temperature')
                ) | abs | round(1) }}
    

    Repeat for other rooms with consistent naming.


    Step 2 Create a Heatmap in Zircon3D

    • Add a new heatmap layer
    • Name it (e.g., Temperature Delta)
    • Select your template sensors

    Step 3 Use Matching Rules (Recommended)

    To scale easily across rooms:

    • Use a rule like:
      uid contains temperature_delta

    This automatically includes all matching sensors.


    Step 4 Configure Color Mapping

    Example:

    • 0°C → Green (good)
    • 3°C → Yellow (moderate)
    • 5°C → Red (needs attention)

    Lower values = better comfort


    Step 5 Assign Devices to Floorplan

    • Place climate/HVAC devices in your 3D layout
    • Or update existing ones to use the heatmap

    Step 6 View the Heatmap

    Switch to the heatmap layer to see your data visualized in 3D.

    762205b2-2324-4266-a44e-0a5b2143046c-2026-04-13 13_10_29-2026-04-13 13_09_22-Sticky Notes (new) - Copy.png

    Beyond Temperature Delta

    You can apply this method to:

    • Greenhouse climate (VPD, humidity)
    • Energy usage per zone
    • Occupancy and utilization
    • Air quality metrics

    📚 Related

    • Main article: See Temperature Differences Across Your Home in 3D
    • Docs: https://zircon3d.com/docs
    Tutorials & FAQ

  • See Temperature Differences Across Your Home in 3D (Temperature Delta Heatmap)
    Tami LiuT Tami Liu

    Turn Derived Data into Real Spatial Insight with Zircon3D

    Understanding how well your HVAC system performs is not just about reading temperatures, it’s about seeing how conditions vary across your entire space.

    With Zircon3D, you can go beyond raw sensor data and visualize derived values like Temperature Delta directly on your 3D floorplan.


    What is Temperature Delta?

    Temperature Delta = |Actual Temperature − Target Temperature|

    This value shows how far each area is from its desired condition:

    • Small difference → Comfortable & balanced
    • Large difference → Struggling to reach target

    Why this matters

    A Temperature Delta heatmap helps you instantly identify:

    • Rooms that are too slow to heat or cool
    • Areas with poor airflow or distribution
    • Zones affected by insulation or layout issues
    • Imbalance across floors or large spaces

    Instead of guessing, you can see the problem in seconds.


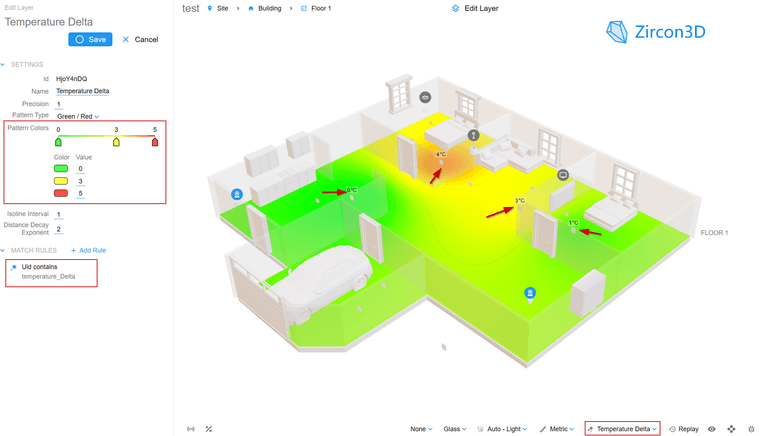
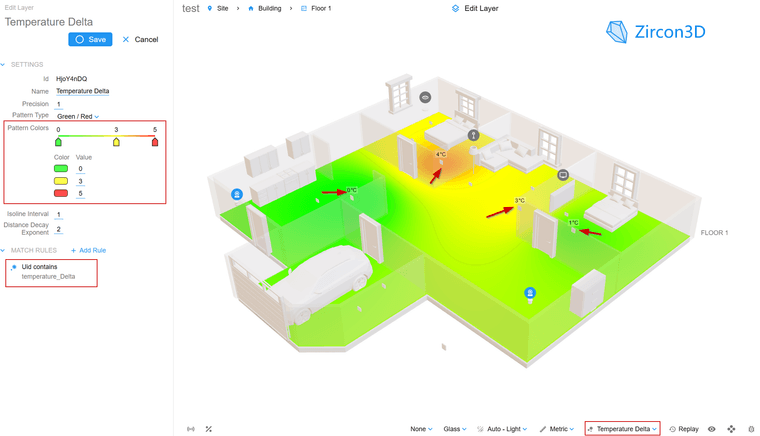
    Example: Temperature Delta Heatmap

    fd3ffdff-b9c8-46d9-906d-74a8865fb7a5-2026-04-13 13_10_29-2026-04-13 13_09_22-Sticky Notes (new) - Copy.png

    In this example:

    The bedroom shows a 4°C difference, highlighted in orange/red which indicating the room is struggling to reach its target temperature.

    Nearby areas around 3°C (yellow) suggest moderate deviation.

    Green zones (0–1°C) indicate rooms that are well balanced and comfortable

    This kind of visualization makes it easy to spot HVAC distribution issues at a glance, especially in multi-room layouts.


    From Raw Data to Insight

    This example highlights a powerful capability of Zircon3D:

    You can visualize computed data, instead of just raw sensors

    Using a template sensor in Home Assistant, you can define your own metrics, such as:

    • Temperature Delta heatmap (this example)
    • VPD (Vapor Pressure Deficit) heatmap for greenhouses
    • Energy usage heatmap per area
    • Occupancy density heatmap
    • Air quality indicators

    Then, render them as a 3D heatmap.


    Key Features Demonstrated

    • ✔️ Support for user-defined data (template sensors)
    • ✔️ Flexible entity matching (e.g., by name prefix)
    • ✔️ Real-time 3D heatmap visualization
    • ✔️ Works with existing HVAC / climate entities
    • ✔️ Scales easily across multiple rooms

    How It Works

    1. Create a Template Sensor in Home Assistant

    template:
      - sensor:
          - name: "Living Room Temperature Delta"
            unique_id: "living_room_temperature_delta"
            unit_of_measurement: "°C"
            state: >
              {{ (
                  state_attr('climate.living_room', 'current_temperature')
                  - state_attr('climate.living_room', 'temperature')
                ) | abs | round(1) }}
    

    This calculates the difference between current and target temperature, and ensures it is always positive and easy to visualize.


    2. Create a Heatmap in Zircon3D

    • Add a new heatmap layer (e.g., Temperature Delta)
    • Select your template sensors
    • Use matching rules (e.g., uid contains temperature_delta) to automatically include multiple rooms

    3. Configure Color Range

    Example:

    • 0°C → Green (good)
    • 3°C → Yellow (moderate)
    • 5°C → Red (needs attention)

    Lower values indicate better comfort.


    4. Assign Devices to the Floorplan

    • Place your HVAC / climate devices in the 3D view
    • Or update existing devices to use the new heatmap

    5. View the Result

    Switch to the heatmap layer and instantly see temperature differences across your space.


    Why This is Powerful

    This is more than a visualization, it’s a data-driven spatial analysis tool.

    You are not limited to built-in metrics. With Zircon3D, you can:

    • Define your own logic
    • Compute custom values
    • Visualize them in 3D space

    Turning your system into a true 3D data dashboard


    Learn More

    • Get started with Zircon3D: https://zircon3d.com
    • Documentation: https://zircon3d.com/docs
    • Community forum (support & discussions): https://forum.zircon3d.com
    • YouTube tutorials: https://www.youtube.com/@Zircon3D
    • Join our Facebook group (updates & previews): https://www.facebook.com/groups/zircon3d

    What’s Next?

    This is just one example of what’s possible.
    We’re continuing to expand support for:

    • More advanced derived metrics
    • Better visualization layers
    • Business and enterprise use cases

    Have ideas or use cases? Let us know, your feedback directly shapes future features.

    Blog & Highlights

  • Default "Floating Cards" mode
    Tami LiuT Tami Liu

    @Vagelis-Melidonis

    Hi,

    Yes, your solution is correct

    The Floating Cards mode is controlled by the View Profile, which is the right place to store your preferred settings for daily use. In the Designer, it will always fall back to the system default settings.

    We know this can be a bit confusing, and we may improve this in the future (for example, allowing it to be set via the URL).

    Let us know if you have any questions

    Questions & Feedback

  • FirebaseError cannot load the addon
    Tami LiuT Tami Liu

    @haoxian2023 Glad it is working now! Good job!

    Questions & Feedback

  • FirebaseError cannot load the addon
    Tami LiuT Tami Liu

    @haoxian2023
    Thanks for the detailed log.

    The new error:

    ENETUNREACH 198.18.0.18:443

    It means the add-on cannot reach the target network at all (network unreachable) from the HA server, which is different from the previous Firebase error. This usually indicates the VPN/proxy is not applied to the Home Assistant add-on container itself, even if it works on your phone or NAS.

    Key point:

    The Zircon3D add-on runs inside a Docker container, and:
    👉 It does NOT automatically use your system/NAS VPN or proxy
    👉 Environment proxy variables often don’t work unless the container is explicitly configured to route traffic through it

    What likely happened
    Your VPN works on your device ✅
    But the HA add-on container is still using the normal network ❌
    So requests to zircon3d.com (and Firebase) fail or get routed to invalid IPs like 198.18.x.x

    Recommended solution

    Run Home Assistant through a system-level VPN:

    Install VPN on your router, or
    Install VPN directly on the Home Assistant host machine

    This ensures all containers (including Zircon3D) can access the internet properly.

    Also, just to confirm, are you located in China?
    Currently, Zircon3D relies on Google Firebase services, which are restricted in China. Because of this, Zircon3D is not well supported in China at the moment due to network limitations.

    Sorry about this, we understand it’s inconvenient and are considering alternative solutions for better regional support in the future.

    Questions & Feedback

  • FirebaseError cannot load the addon
    Tami LiuT Tami Liu

    @haoxian2023
    Hi, it seems Google services (including Firebase Authentication) are blocked, so Zircon3D cannot create the online session. That’s why you see:

    auth/network-request-failed (fetch failed)

    Zircon3D currently requires access to Google Firebase for login/session initialization, even though the rest of the system runs locally.

    Possible solutions:
    1. Use a network that can access Google services (VPN or similar)
    2. Configure your router or system to allow outbound access to Firebase/Google APIs
    3. If you already have a VPN on your network, make sure the Home Assistant machine (not just your phone/PC) is also using it

    Notes:
    • This issue is not related to your Home Assistant setup, your logs show HA connection is working fine
    • It’s purely a network restriction to Firebase

    Questions & Feedback

  • slider button for shades
    Tami LiuT Tami Liu

    @Nima-Hamed Thanks for the reply!
    Tuya is great to know, that helps us a lot when planning support.

    Regarding the touch experience: in our latest version, we’ve introduced a Control panel designed for touch devices (please see the attached screenshot). This is a temporary solution to improve usability on phones and tablets.

    If you don’t see the control icon in the bottom bar, please make sure your add-on is updated to the latest version.

    We agree that touch interaction is very important, and improving it is definitely on our roadmap. We’ll continue refining the experience and adding more touch-friendly features in future updates.

    Thanks again for your feedback!cff316b0-19f7-40fb-adae-3d6de016e816-image.png

    Questions & Feedback

  • slider button for shades
    Tami LiuT Tami Liu

    Hi Nima, thanks for your question!

    At the moment, shade/cover controls (such as a position slider) are not yet supported in the UI. However, we’ve discussed this with our team, and support for window shades, including slider-based position control, is definitely on our roadmap for a future update.

    If I may ask, what brand or integration are you using for your shade motors? This helps us ensure the feature works well with real-world setups.

    In the meantime, you can still link your shade entities to objects in the 3D view and monitor their state. Interactive control (like adjusting the position directly from the floorplan) will be available in a future release.

    Thanks again for your feedback, it’s very helpful for us!

    Questions & Feedback

  • Zircon3D v2.1 – UI Improvements, Heatmap Enhancements, and Better Mobile Controls
    Tami LiuT Tami Liu

    We’re excited to announce Zircon3D v2.1, bringing several usability improvements, better visualization controls, and refinements based on user feedback. This update focuses on improving the experience on mobile devices, heatmap visualization, and floorplan editing precision.

    Below are the highlights of this release.
    ou can also check out the video overview of this release here:
    🎥 https://youtu.be/3_3LnBEamoQ


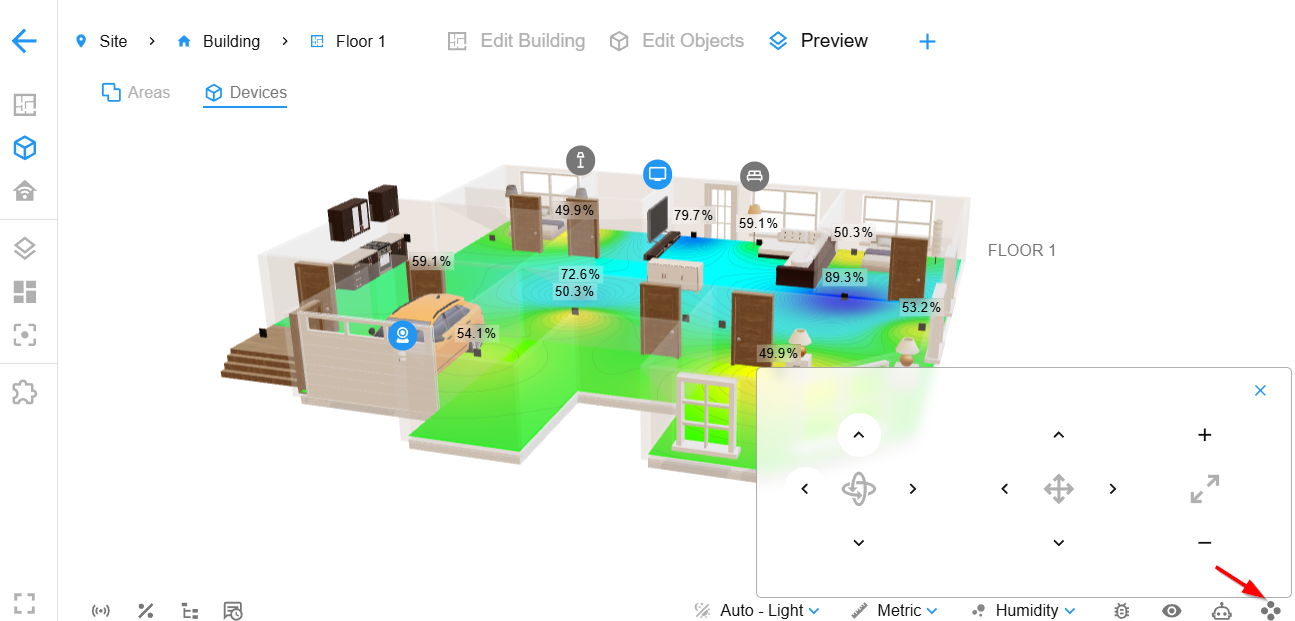
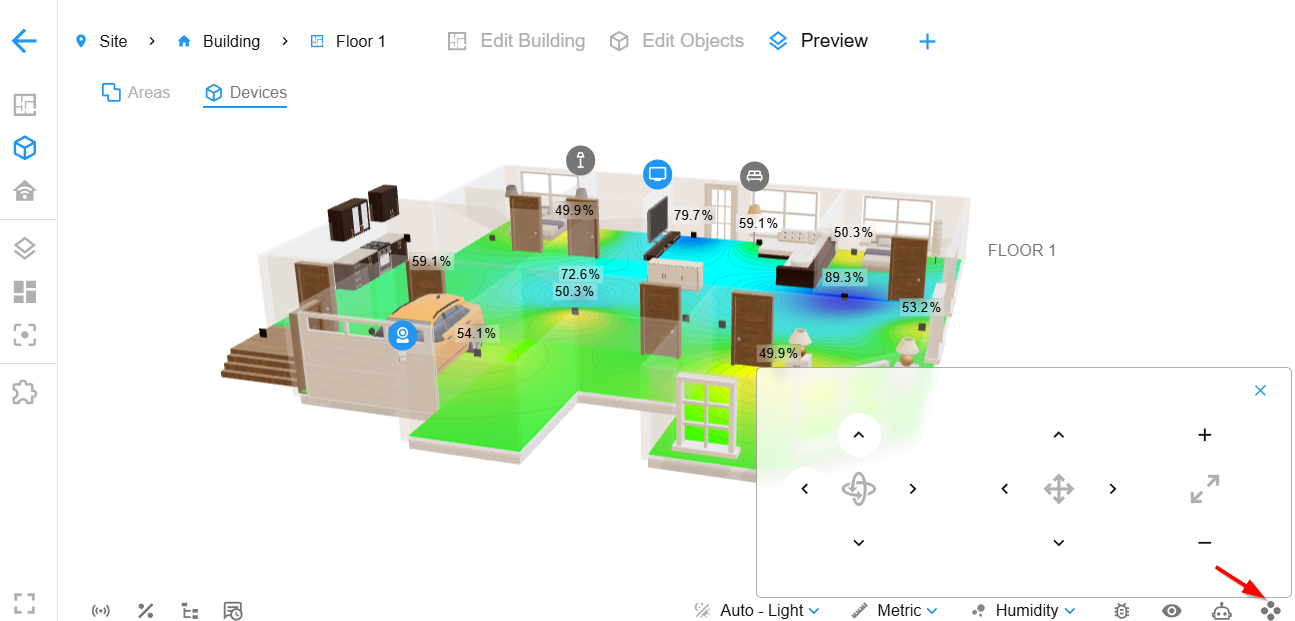
    3D View Control Buttons (Mobile & Tablet Friendly)

    To improve usability on touch devices, we added on-screen control buttons for common camera actions:

    • Rotate view
    • Pan the scene
    • Zoom in/out

    These controls make it much easier to navigate the 3D scene on tablets and phones, especially for wall-mounted dashboards or touchscreen environments.

    cff316b0-19f7-40fb-adae-3d6de016e816-image.png


    Data Card Display & Heatmap Overlay Improvements

    We improved how data cards interact with heatmaps and added new display controls to reduce visual clutter when monitoring your building, including:

    • Better readability when heatmaps are active
    • Reduced overlapping between heatmaps and data panels
    • Cleaner visualization in environments with many sensors

    These improvements make the heatmap view clearer and easier to interpret, especially in complex buildings with dense sensor deployments.

    f42d4a1e-1a7e-40a6-bd0f-0a9ce81aec46-image.png

    Card Display Modes

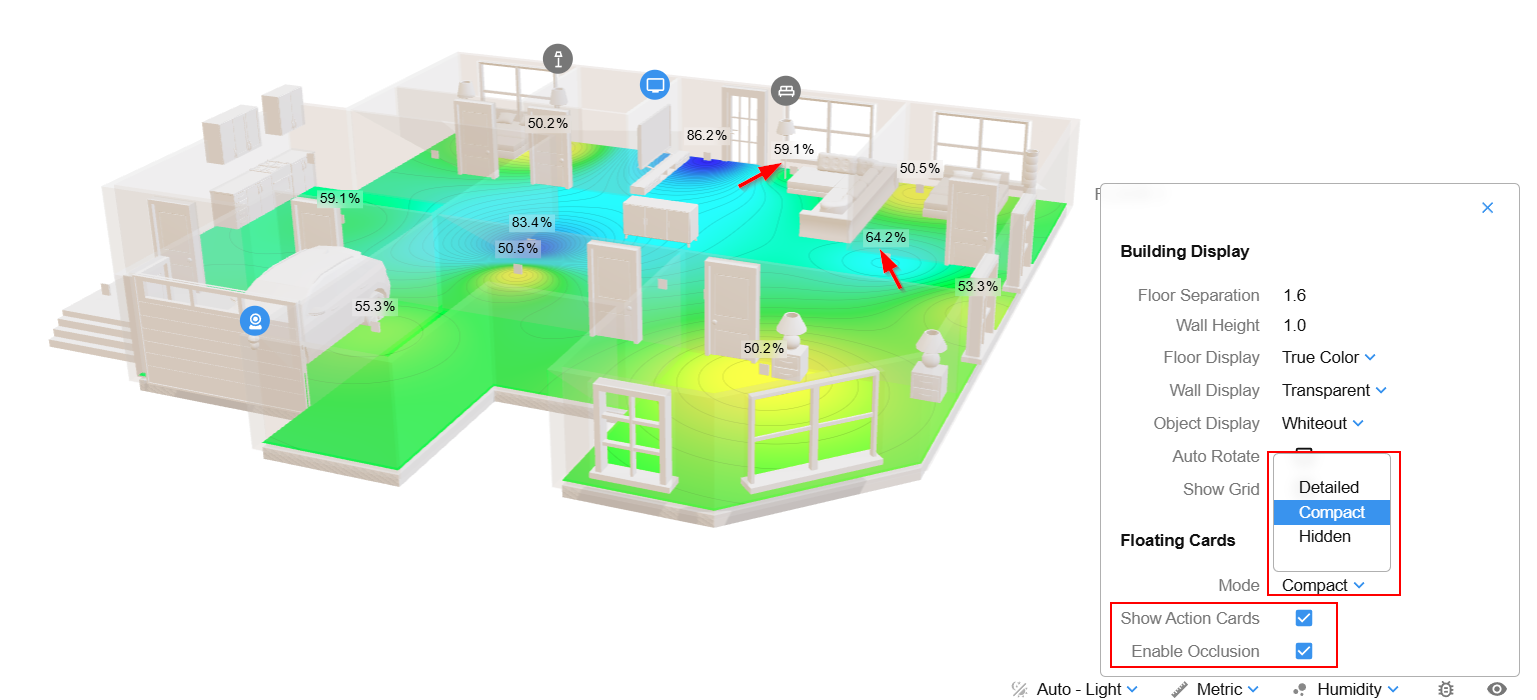
    Three modes are available:

    • Detailed – Show all sensor data panels (current behavior).
    • Compact – Only show data panels related to the currently selected heatmap value.
    • Hidden – Hide all floating data panels for a clean heatmap visualization.

    This makes it easier to focus on specific environmental metrics without unrelated sensors cluttering the view.

    Additional Display Options

    Two new options provide further control over what appears in the 3D scene:

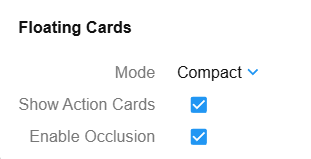
    • Show Action Cards – Toggle the display of interactive device cards such as switches or cameras. These appear as small icon bubbles in the scene.
    • Enable Occlusion – Prevent data panels and action icons from rendering through floors. Elements hidden behind floors will now remain hidden, improving visual realism in multi-floor buildings.

    404d8b17-a290-4d10-a928-ffbbae75c935-image.png


    Sensor Icons for Better International Usability

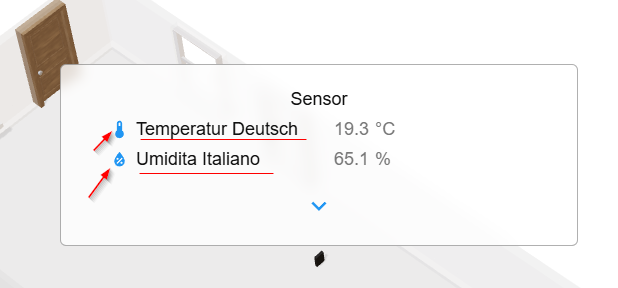
    Zircon3D now supports automatic sensor icons for common values such as:

    • Temperature
    • Humidity

    These icons appear in the data panel, making sensor types easier to identify even when entity names are not in English.

    921fb6e7-cbf8-4a92-a019-f3aafe005e22-image.png


    Disable Wall/Room Auto-Attach Helper by Holding Shift

    When editing floorplans, Zircon3D normally uses an auto-attach helper to snap walls and objects together.

    For more precise editing, you can now:

    Hold the Shift key to resize rooms freely without auto-attach helper.

    This allows finer control when adjusting room shapes or sizes.


    Preview Button for Quick Viewing

    A new Preview button has been added to the top toolbar.

    This allows you to instantly preview your building visualization without manually switching to another view tab. You can quickly check how your floorplan and devices appear in the final scene while editing.

    This makes the workflow faster when designing your building, letting you switch between editing and viewing at any time with a single click.

    5c145f3d-02b4-4c0a-8bd5-0aa2499a2f4b-image.png


    Automatic Switching Between Editing Modes

    Zircon3D now automatically switches between Building Edit Mode and Object Edit Mode based on the element you select in the scene.

    • Building Edit Mode – for editing structural elements such as walls and rooms.
    • Object Edit Mode – for editing objects such as furniture, doors, windows, and devices.

    This removes the need to manually change editing modes and makes the editing workflow more intuitive when building your home or facility model.


    Bug Fixes & Performance Improvements

    As always, this release also includes:

    • Various bug fixes
    • Performance improvements
    • General stability enhancements

    💬 Feedback Welcome

    Many of these improvements were inspired by community feedback.
    If you have suggestions or feature ideas, feel free to share them in the forum.


    Announcements & Updates

  • Does Zircon3D Require the Cloud?
    Tami LiuT Tami Liu

    A common question from new users is whether Zircon3D requires a cloud connection to run.

    The short answer is no, Zircon3D is designed to run locally.

    Local Operation

    All core functionality of Zircon3D runs locally inside your Home Assistant add-on, including:

    • 3D floorplan modeling
    • Real-time data visualization
    • Heatmaps and dashboards
    • Sensor monitoring
    • Device interaction and controls

    Zircon3D reads data directly from your Home Assistant instance, so your monitoring and visualization continue to work even without external services.

    Your data and floorplans remain stored locally on your system.

    Zircon3D Account and Licensing

    To use Zircon3D, you will need a Zircon3D online account.
    This account is used for license management.

    Normally, the add-on performs a quick online license verification.

    Offline Activation

    If your system does not have internet access, Zircon3D can still be activated.

    You can generate a manual license token from the Zircon3D website and paste it into the add-on to activate your license.

    This allows Zircon3D to continue operating in restricted or offline environments.

    Optional Cloud Backup for Floorplans

    Zircon3D also provides an optional cloud backup for your floorplan projects.

    If enabled, your floorplan design can be uploaded to the cloud, which helps prevent data loss if you reinstall Home Assistant or move to another system.

    Important to note:

    • Only floorplan project data is stored in the cloud
    • Sensor data and Home Assistant data are never uploaded
    • Visualization still reads live data directly from Home Assistant

    You can learn more about local vs cloud mode in this article:

    https://forum.zircon3d.com/topic/9/explained-zircon3d-local-vs-cloud-mode

    Summary

    • ✔ 3D rendering and visualization run locally
    • ✔ Data comes directly from Home Assistant
    • ✔ Your monitoring data stays inside Home Assistant
    • ✔ A Zircon3D account is required for licensing
    • ✔ Offline activation is supported
    • ✔ Optional cloud backup for floorplan projects

    This design keeps Zircon3D aligned with the local-first philosophy of the Home Assistant ecosystem while still providing optional convenience features.

    Tutorials & FAQ

  • slider button for shades
    Tami LiuT Tami Liu

    Hi,

    Thanks for the feedback and for sharing your use case!

    That’s a very interesting idea. We’ll discuss this feature with our team, and we’ll get back to you after evaluating it.

    Questions & Feedback

  • cannot find heaters or import them
    Tami LiuT Tami Liu

    @lina-sayeb Hi,

    At the moment, Zircon3D doesn’t support importing external 3D models (such as .gltf files) yet.

    For now, you have a couple of options:

    1. Use the existing Air Conditioner model
    You can place the current Air Conditioner object in the scene as a visual placeholder for the heater.

    2. Add the real device from Home Assistant
    If the heater is a device in Home Assistant, you can:

    • Open the Monitoring tab
    • Find your heater / temperature entity
    • Drag and drop it onto the floorplan

    It will be placed in the scene as a sensor, and you’ll still be able to see all the monitoring data associated with it.

    We know that allowing users to add custom objects is a useful feature, and it’s something we plan to improve in the future.

    If you have any other questions while working on your project, feel free to ask, happy to help!

    Questions & Feedback
  • Login

  • Don't have an account? Register

  • Login or register to search.
Powered by NodeBB Contributors
  • First post
    Last post
0
  • Categories
  • Recent
  • Tags
  • Popular
  • World
  • Users
  • Groups