Skip to content

Blog & Highlights

Blog posts, use cases, and stories from the Zircon3D community.

This category can be followed from the open social web via the handle blogs@forum.zircon3d.com

7 Topics 7 Posts
  • 0 Votes
    1 Posts
    272 Views
    Tami LiuT
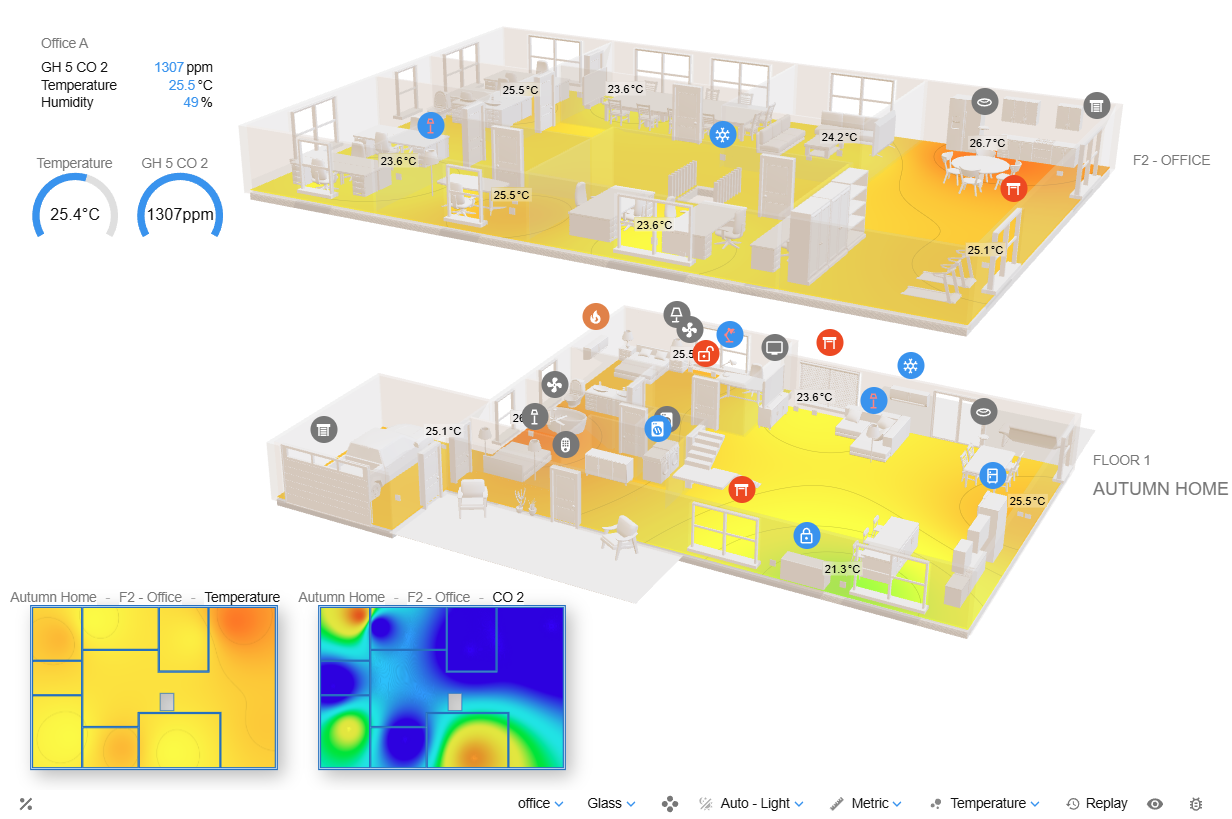
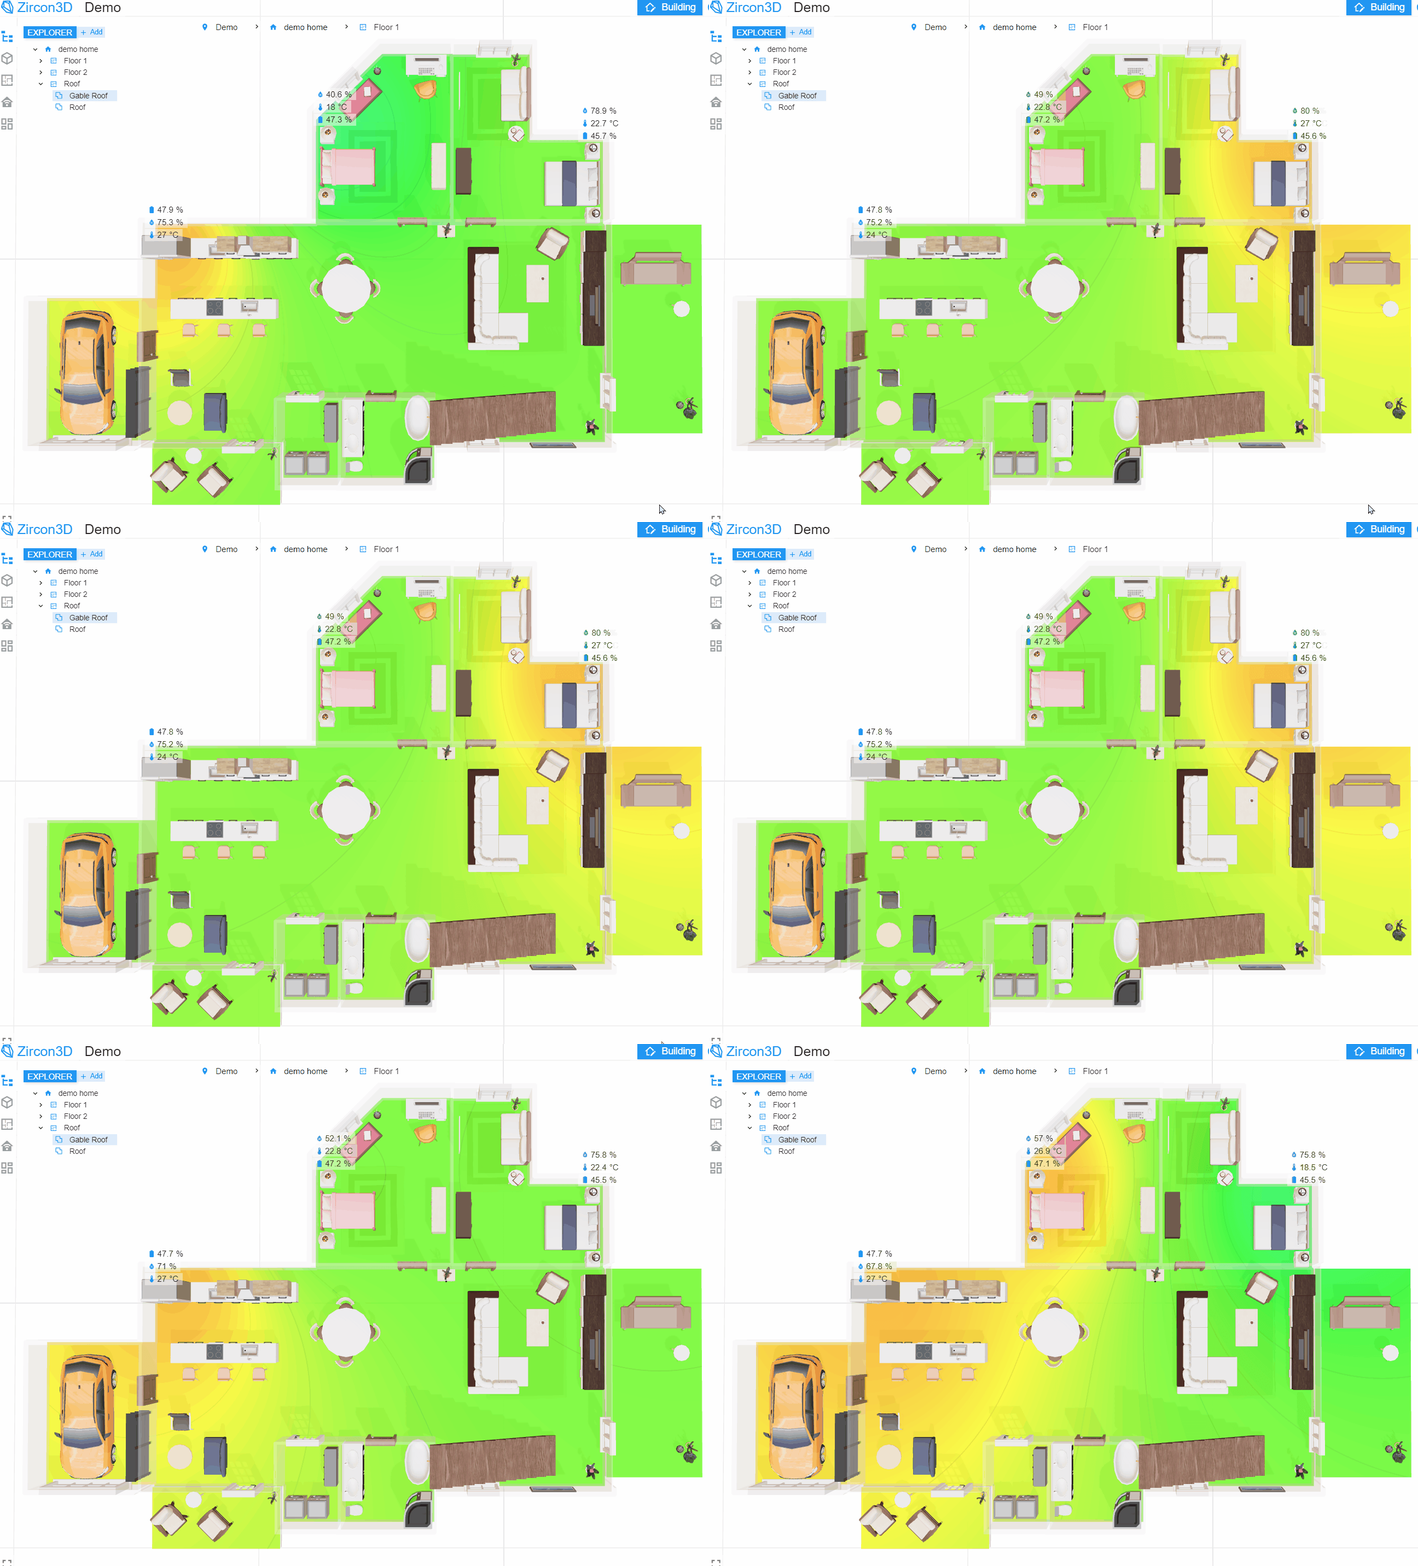
    Learn how Zircon3D maps real-time IoT sensor data to interactive 3D models, heatmaps, dashboards, and digital twin views through Home Assistant. Collecting IoT sensor data is usually not the hardest part of an IoT project. Platforms such as Home Assistant, MQTT brokers, building management systems, gateways, and industrial controllers can already collect temperature, humidity, air quality, occupancy, energy, equipment status, and other measurements. The more difficult question is: How can we show real-time IoT sensor data in its actual physical location inside a 3D model? A traditional IoT dashboard presents values through cards, charts, tables, and gauges. These are useful, but they often remove the spatial context of the data. A value may tell you that one sensor reports a high temperature, but it does not immediately show where that sensor is located, which room is affected, or what equipment is nearby. A 3D IoT visualization adds this missing spatial context. Instead of looking at an isolated list of sensor values, users can see the building, room, greenhouse, office, facility, or equipment layout and understand what is happening in the real environment. This is the type of problem Zircon3D is designed to solve. [image: 1784913397375-84fd0249-14ce-4246-93cd-565916922892-zircon3d-3d-iot-visualization-digital-twin-2.png] Zircon3D combines an interactive 3D environment with real-time IoT sensor data, heatmaps, dashboards, and device controls What Is a 3D IoT Digital Twin? The term “digital twin” can describe several different types of systems. At the most advanced level, a digital twin may include engineering simulation, predictive models, structural analysis, physics calculations, maintenance planning, and lifecycle management. However, many IoT projects have a more practical objective: Display a building or facility as an interactive 3D model. Place sensors and connected devices in their real locations. Show live values and device states. Highlight environmental conditions with heatmaps. Review historical changes. Control supported devices from the same interface. This can be described as a visual or operational digital twin. Its purpose is not to simulate every physical process. Its purpose is to create a live spatial view of the real environment so that operators can understand conditions more quickly. Zircon3D focuses on this visualization layer. The Traditional Way: Building a Custom 3D IoT Application A developer building a 3D IoT visualization from scratch may consider a technology stack such as: Blender for creating the 3D model. glTF or GLB for exporting the model. Three.js, Babylon.js, or Unity for rendering. MQTT or WebSocket for real-time communication. A backend service for authentication and device mapping. A database for current and historical sensor values. Custom shaders, labels, charts, and user-interface components. Custom code to associate sensor IDs with objects in the 3D scene. This approach offers complete control, but it can quickly become a large software-development project. Rendering a model is only the beginning. The application must also manage camera controls, model optimization, device synchronization, data mapping, sensor history, user permissions, mobile performance, dashboards, error handling, and deployment. For a research project or highly specialized industrial application, custom development may be appropriate. For a smart home, greenhouse, office, school, laboratory, farm, or small facility, building all of these components from the beginning may not be necessary. Zircon3D provides these capabilities as a ready-to-use visualization platform. [image: 1784913635156-03dda3cf-d0af-419f-b684-4fcfb0d02072-3d-builder.png] Creating the 3D Environment Zircon3D includes a visual designer for creating buildings, floors, walls, rooms, doors, windows, furniture, and other objects. Users do not need to create the entire building in Blender or write code to display it. The floorplan can be created directly in the Zircon3D Designer. For specialized assets, users can also upload their own .glb models. This makes it possible to add custom equipment, machinery, furniture, greenhouse components, facility assets, or other objects that are not available in the standard model library. Simple resizable objects can also be used as equipment blocks, platforms, partitions, cabinets, tables, storage areas, or placeholders. This provides two ways to build a scene: Create the building and its rooms directly in Zircon3D. Add custom GLB models for specialized equipment or visual details. How Sensor Data Is Mapped to the 3D Model One of the most important questions in a digital twin project is how to associate a sensor with the correct location or object. In a custom Three.js or Unity application, this normally requires manually assigning identifiers to meshes or scene objects and then writing code that updates those objects when new data arrives. Zircon3D uses a visual mapping workflow instead. After devices and entities are imported from Home Assistant, a user can position a monitored device at its real location inside the 3D floorplan. Its entities can then be used by different visualization components. For example, a temperature sensor can be: Positioned in the room where it is installed. Displayed through a floating information card. Included in a temperature heatmap. Added to a dashboard. Included in a saved monitoring view. Used during historical heatmap replay. The same approach can be used for humidity, air quality, carbon dioxide, energy, occupancy, battery level, equipment state, and other numeric or status-based entities. This means the relationship between the physical world and the digital model is created visually rather than through custom mesh scripting. [image: 1784913687467-6c07ccbe-2128-4d09-850c-f1739d22eedc-how-sensor-data-is-mapped-to-the-3d-model.png] Sensors and Home Assistant entities can be positioned visually at their real locations inside the 3D floorplan. Handling Real-Time IoT Sensor Data Zircon3D currently integrates with Home Assistant, which acts as the IoT integration and device-management layer. Home Assistant collects data from connected devices and exposes them as devices and entities. Zircon3D imports those entities and receives their state changes through a local proxy service. When a value changes in Home Assistant, the corresponding Zircon3D visualization can update automatically. These updates can appear in several forms: A new numeric value on a floating sensor card. A change in a device’s on/off state. A status indicator showing that a door, window, or lock is open. A changing color or pattern in a heatmap. An updated dashboard gauge, value card, or chart. A control card reflecting the current state of a device. The visualization therefore remains connected to the real environment rather than becoming a static 3D rendering. Can Zircon3D Visualize MQTT Sensor Data? Zircon3D does not currently require users to connect it directly to every individual IoT protocol. Instead, Home Assistant provides the integration layer. When an MQTT sensor is configured in Home Assistant and exposed as an entity, Zircon3D can use that entity in the same way as other Home Assistant data. A typical data flow can therefore look like this: IoT sensor → MQTT broker → Home Assistant → Zircon3D This separation keeps the responsibilities clear: The device platform or MQTT broker transports the sensor data. Home Assistant manages integrations, entities, and device states. Zircon3D provides the interactive 3D visualization. Users do not need to create a separate MQTT-to-Three.js application simply to place live sensor values inside a building model. More Than Sensor Labels: Spatial Heatmaps Displaying a value above a sensor is useful, but it still represents only one measurement point. Heatmaps provide a broader understanding of how conditions change across a space. Zircon3D can map multiple sensors into a heatmap layer and display the estimated distribution of a quantity across the floorplan. Common examples include: Temperature distribution across rooms. Humidity differences inside a greenhouse. Carbon-dioxide levels in classrooms or offices. Air-quality conditions across a facility. Wi-Fi signal strength. Custom numeric sensor measurements. This helps answer questions that are difficult to understand from a table: Which part of the building is becoming too warm? Is humidity concentrated in one greenhouse zone? Are environmental conditions consistent between rooms? Which area changes first when the HVAC system starts? Where are additional sensors needed? Heatmap replay can also be used to examine how conditions changed over a selected period, adding a time dimension to the 3D IoT visualization. [image: 1784913754367-76fcb9c0-130d-4dfe-aaf6-a006cb591477-co2-heatmap.png] Spatial heatmaps make it easier to understand how temperature, humidity, air quality, and other measurements vary across the environment. Combining 3D Visualization with IoT Dashboards Not every value is best represented directly on the model. A good monitoring interface combines spatial visualization with conventional dashboard components. Zircon3D allows dashboards to be displayed together with the 3D scene. A monitoring view can therefore include: The interactive building model. Floating sensor values. Environmental heatmaps. Gauges and value cards. Historical charts. Device status indicators. Control cards. Saved camera and display settings. The 3D model answers where something is happening, while the dashboard provides detailed values and trends. [image: 1784913850792-09c14971-9334-4879-81ae-af8955a5f166-2026-06-09-18_55_50-_zircon3d-file-explorer-resized.png] The 3D model explains where an event is happening, while dashboard cards provide detailed values and trends. Monitoring and Controlling Connected Devices A digital twin does not have to be view-only. Zircon3D supports control cards for compatible Home Assistant entities, including lights, switches, covers, climate devices, locks, and fans. A user can select a device in its physical location and access the relevant controls. Depending on the device, this may include: Turning a light or switch on and off. Adjusting light brightness or color. Opening or closing a cover. Changing a thermostat setting. Controlling a fan. Locking or unlocking a supported lock entity. Commands are sent through Home Assistant rather than directly from Zircon3D to the physical device. This allows Zircon3D to remain a visualization and interaction layer while Home Assistant continues to manage device communication and automation. [image: 1784913947267-1ecb3820-dbbf-4294-8409-17dfb8c00e4d-smart-control.png] Supported Home Assistant devices can be monitored and controlled from their physical locations in the 3D model. Local-First IoT Data and Privacy Privacy is an important consideration for smart buildings and digital twins. When Zircon3D is installed through the Home Assistant add-on or Docker service, communication with Home Assistant occurs locally. Sensor readings, device states, and locally stored monitoring history remain on the user’s own system. Zircon3D Cloud is used for account and license management rather than storing live Home Assistant monitoring data. This local-first architecture can be useful for: Private homes. Schools and educational projects. Small businesses. Farms and greenhouses. Laboratories. Facilities with sensitive operational data. Installations with limited internet connectivity. The visualization can continue to operate as part of the local environment without sending every sensor update to an external IoT visualization service. What Zircon3D Is and What It Is Not Zircon3D is best suited to spatial monitoring and interaction. It can show where sensors and devices are located, visualize their current values, present environmental heatmaps, display historical information, and provide supported device controls. It is not intended to replace specialized engineering tools for: Finite-element analysis. Structural deformation simulation. Computational fluid dynamics. Mechanical stress analysis. Physics-based equipment simulation. Predictive engineering models. For a digital twin that must simulate how pressure physically deforms a machine component, specialized engineering software or a custom application may still be required. For a digital twin that needs to show the current pressure, temperature, position, alarm state, or operating condition of equipment inside a building or facility, Zircon3D can provide the visualization layer without requiring a new application to be developed from scratch. A Practical Workflow for Building a 3D IoT Visualization A basic Zircon3D project can follow this process: 1. Connect sensors to Home Assistant Configure the IoT devices and confirm that their values appear as Home Assistant entities. 2. Create the building or facility layout Use Zircon3D Designer to create floors, rooms, walls, doors, windows, and important physical areas. 3. Add equipment and custom models Use built-in objects, resizable simple objects, or uploaded GLB models to represent important equipment and assets. 4. Position monitored devices Place each sensor or device at the location that corresponds to its installation in the real environment. 5. Map the sensor data Display the entities through floating cards, dashboards, heatmap layers, status indicators, or saved monitoring views. 6. Create operational views Save different camera positions and visualization settings for purposes such as environmental monitoring, security, energy, equipment status, or executive overview. 7. Display the visualization Open Zircon3D directly or embed a saved view inside a Home Assistant dashboard. This process creates a practical digital twin without requiring users to build their own 3D engine, WebSocket service, device-mapping database, and visualization interface. Frequently Asked Questions Do I need Three.js or Unity to build a 3D IoT dashboard? Not necessarily. These tools are useful for completely custom applications, but Zircon3D provides a ready-made 3D visualization environment for buildings, rooms, sensors, and Home Assistant entities. Can I use a model created in Blender? Yes. Custom assets can be exported from Blender in GLB format and uploaded to Zircon3D. The building layout can also be created directly with the Zircon3D Designer. How do I connect a sensor to a specific location? Import the sensor entity from Home Assistant, mount the monitored device in the 3D floorplan, and position it at the corresponding physical location. Its values can then be shown through cards, heatmaps, dashboards, and monitoring views. Does Zircon3D support real-time sensor updates? Yes. Changes received from Home Assistant can automatically update the 3D view, sensor cards, dashboards, and heatmaps. Can it visualize MQTT data? Yes, when the MQTT sensor or device is configured as an entity in Home Assistant. Zircon3D uses the entity exposed by Home Assistant rather than connecting separately to the MQTT broker. Does it require a cloud IoT platform? No external cloud IoT platform is required for Home Assistant monitoring. The Zircon3D proxy can run locally as a Home Assistant add-on or Docker service, and monitoring data stays within the local environment. Is Zircon3D only for smart homes? No. The same approach can be used for greenhouses, farms, offices, schools, laboratories, workshops, equipment rooms, and small or medium-sized facilities. A More Accessible Approach to 3D IoT Visualization Building a digital twin no longer has to begin with selecting a game engine and creating an entire custom software stack. When the objective is to visualize real-time sensor data in its physical context, Zircon3D provides a more direct approach: Create an interactive 3D building model. Position sensors and devices in their real locations. Connect live Home Assistant entities. Display values, states, dashboards, and heatmaps. Review historical environmental changes. Control supported devices. Keep monitoring data local. The result is a practical 3D IoT visualization that connects the digital model with the real environment while reducing the development work normally required. Explore Zircon3D, read the documentation, or join the Zircon3D community to learn more.

  • 0 Votes
    1 Posts
    169 Views
    Tami LiuT
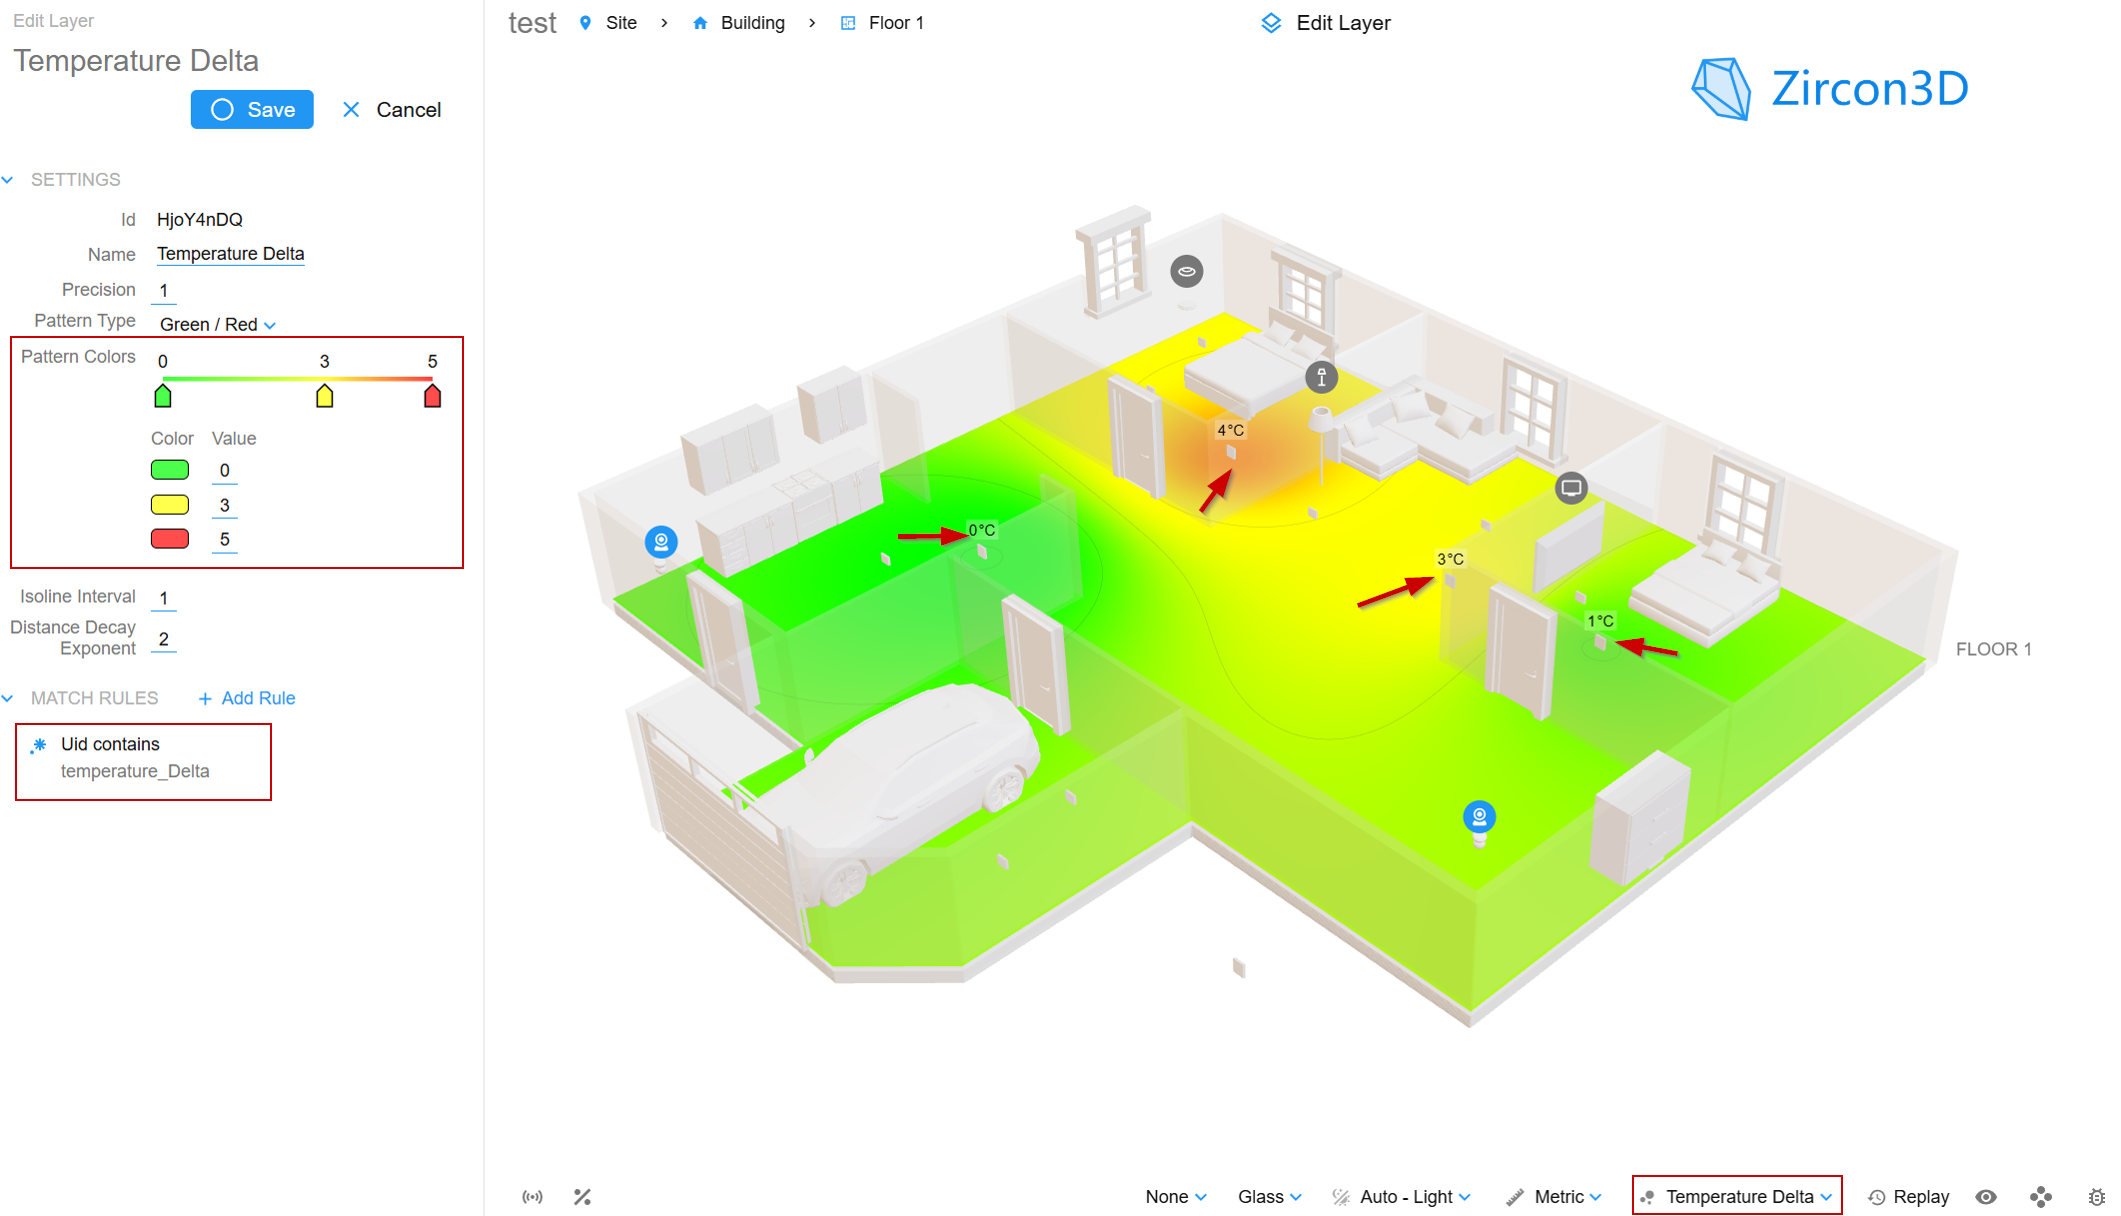
    Turn Derived Data into Real Spatial Insight with Zircon3D Understanding how well your HVAC system performs is not just about reading temperatures, it’s about seeing how conditions vary across your entire space. With Zircon3D, you can go beyond raw sensor data and visualize derived values like Temperature Delta directly on your 3D floorplan. What is Temperature Delta? Temperature Delta = |Actual Temperature − Target Temperature| This value shows how far each area is from its desired condition: Small difference → Comfortable & balanced Large difference → Struggling to reach target Why this matters A Temperature Delta heatmap helps you instantly identify: Rooms that are too slow to heat or cool Areas with poor airflow or distribution Zones affected by insulation or layout issues Imbalance across floors or large spaces Instead of guessing, you can see the problem in seconds. Example: Temperature Delta Heatmap [image: 1776097180916-fd3ffdff-b9c8-46d9-906d-74a8865fb7a5-2026-04-13-13_10_29-2026-04-13-13_09_22-sticky-notes-new-copy-resized.png] In this example: The bedroom shows a 4°C difference, highlighted in orange/red which indicating the room is struggling to reach its target temperature. Nearby areas around 3°C (yellow) suggest moderate deviation. Green zones (0–1°C) indicate rooms that are well balanced and comfortable This kind of visualization makes it easy to spot HVAC distribution issues at a glance, especially in multi-room layouts. From Raw Data to Insight This example highlights a powerful capability of Zircon3D: You can visualize computed data, instead of just raw sensors Using a template sensor in Home Assistant, you can define your own metrics, such as: Temperature Delta heatmap (this example) VPD (Vapor Pressure Deficit) heatmap for greenhouses Energy usage heatmap per area Occupancy density heatmap Air quality indicators Then, render them as a 3D heatmap. Key Features Demonstrated ️ Support for user-defined data (template sensors) ️ Flexible entity matching (e.g., by name prefix) ️ Real-time 3D heatmap visualization ️ Works with existing HVAC / climate entities ️ Scales easily across multiple rooms How It Works 1. Create a Template Sensor in Home Assistant template: - sensor: - name: "Living Room Temperature Delta" unique_id: "living_room_temperature_delta" unit_of_measurement: "°C" state: > {{ ( state_attr('climate.living_room', 'current_temperature') - state_attr('climate.living_room', 'temperature') ) | abs | round(1) }} This calculates the difference between current and target temperature, and ensures it is always positive and easy to visualize. 2. Create a Heatmap in Zircon3D Add a new heatmap layer (e.g., Temperature Delta) Select your template sensors Use matching rules (e.g., uid contains temperature_delta) to automatically include multiple rooms 3. Configure Color Range Example: 0°C → Green (good) 3°C → Yellow (moderate) 5°C → Red (needs attention) Lower values indicate better comfort. 4. Assign Devices to the Floorplan Place your HVAC / climate devices in the 3D view Or update existing devices to use the new heatmap 5. View the Result Switch to the heatmap layer and instantly see temperature differences across your space. Why This is Powerful This is more than a visualization, it’s a data-driven spatial analysis tool. You are not limited to built-in metrics. With Zircon3D, you can: Define your own logic Compute custom values Visualize them in 3D space Turning your system into a true 3D data dashboard Learn More Get started with Zircon3D: https://zircon3d.com Documentation: https://zircon3d.com/docs Community forum (support & discussions): https://forum.zircon3d.com YouTube tutorials: https://www.youtube.com/@Zircon3D Join our Facebook group (updates & previews): https://www.facebook.com/groups/zircon3d What’s Next? This is just one example of what’s possible. We’re continuing to expand support for: More advanced derived metrics Better visualization layers Business and enterprise use cases Have ideas or use cases? Let us know, your feedback directly shapes future features.
  • How Zircon3D Fits Small Business Users Running Home Assistant

    1
    0 Votes
    1 Posts
    276 Views
    Tami LiuT
    Home Assistant is widely known as a powerful platform for smart homes. But in practice, many people also use it to monitor small businesses, workshops, farms, greenhouses, and commercial spaces. As sensor networks grow and buildings become more complex, traditional dashboards often become cluttered and difficult to interpret. Zircon3D was designed to solve this problem by adding a digital twin layer on top of Home Assistant, by turning raw sensor data into an interactive 3D representation of your physical space. This approach makes it easier to monitor environments, identify patterns, and manage devices across an entire facility. From Smart Home Dashboard to Digital Twin Most Home Assistant dashboards list devices as cards or charts. This works well for a handful of sensors, but it becomes challenging when a building contains dozens or hundreds of devices. Zircon3D introduces a 3D facility view where sensors, equipment, and spaces are mapped directly into a building model. Instead of scrolling through lists, users can visually explore their environment and immediately understand what is happening in each location. For example: Temperature sensors appear where they are physically installed Machines or appliances can be mapped to specific areas Environmental patterns become visible across rooms or zones This spatial approach helps transform Home Assistant from a device dashboard into a visual monitoring system. Business-Specific Capabilities Multi-Building and Multi-Floor Monitoring Small businesses often operate in spaces that include multiple floors or separate buildings. Zircon3D projects can organize these layouts into a single visual environment. This allows users to monitor sensors across: different floors multiple buildings separate operational areas All within one unified view. Facility Monitoring and Equipment Mapping Zircon3D makes it possible to associate sensors with the physical equipment or spaces they represent. Common monitoring scenarios include: Energy consumption across rooms or machines Air quality monitoring in offices or labs Temperature tracking in storage rooms or server racks Environmental monitoring for plants or food storage Instead of reading numbers in isolation, users can immediately see where the issue occurs in the building. Thermal and Heatmap Analytics One of Zircon3D’s most powerful features is the real-time heatmap system. Heatmaps transform sensor data into a color-based visualization that reveals environmental patterns across a space. This is especially useful for: greenhouses monitoring temperature or humidity distribution server rooms detecting heat concentration warehouses checking environmental uniformity offices analyzing comfort conditions Users can also replay historical heatmaps to review how conditions changed throughout the day. Performance on Home Assistant Hardware Zircon3D uses a GPU-accelerated WebGL rendering engine, allowing complex 3D scenes to run smoothly inside a browser. Even installations running on modest hardware, such as a Home Assistant OS system or small server can display interactive environments with large numbers of sensors. The goal is to provide professional-level visualization without requiring enterprise-grade infrastructure. Data Privacy and Local Control For many small businesses, data privacy and operational security are essential. Zircon3D runs entirely inside Home Assistant as a local add-on, which means: sensor data never leaves the local system building models remain private monitoring operates even without internet connectivity This local-first design ensures that sensitive operational data stays under the user’s control. Scalable Plans for Growing Systems Zircon3D offers a free plan for smaller installations and personal projects. As deployments grow, paid tiers provide higher limits for: project size building areas number of monitored entities This allows users to start small and scale the system as their business expands. More details can be found here: https://zircon3d.com/pricing Simplifying Complex Facilities Large monitoring systems often overwhelm users with data. Zircon3D includes different view modes that help simplify complex environments. For example: Transparent Mode makes walls semi-transparent to reveal sensors behind them Whiteout Mode highlights devices and monitoring data while reducing visual distractions These modes allow managers to quickly locate devices and understand the state of a facility. A Practical Alternative to Enterprise Systems Enterprise facility-management platforms often require expensive hardware, specialized software, and complex deployment processes. Zircon3D offers a lightweight alternative by building on top of the Home Assistant ecosystem: no specialized infrastructure required simple deployment as a Home Assistant add-on flexible enough for both individuals and businesses For many small organizations, this makes advanced monitoring capabilities accessible without enterprise-level costs. Learn More Documentation: https://zircon3d.com/docs Home Assistant Community Discussion: https://community.home-assistant.io/ Pricing Information: https://zircon3d.com/pricing YouTube Tutorials & Examples: https://www.youtube.com/@Zircon3D
  • Why Zircon3D Is Built for High Performance

    1
    0 Votes
    1 Posts
    140 Views
    Tami LiuT
    Design decisions, technology choices, and what to expect on mobile and tablets Zircon3D is often described as “fast” or “smooth,” but that performance is not accidental. It is the result of deliberate architectural and technical choices made from the very beginning of the project. This article explains why Zircon3D performs the way it does, what technologies make it possible, and why certain interactions especially on phones and tablets are currently more limited, even though the core system itself remains highly performant. A real-time system, not a rendering pipeline Many traditional 3D tools follow a render-first workflow: Design → export → render → view Any change requires reprocessing the entire scene Zircon3D follows a different approach. It is built as a real-time visualization engine, where: The 3D scene is always live Data changes update the scene incrementally There is no export or re-render cycle This is a fundamental reason why interactions feel immediate and responsive. GPU-accelerated rendering with WebGL At its core, Zircon3D runs on a GPU-accelerated WebGL rendering pipeline, which means: Heavy visual work is handled by the graphics card, not the CPU Large scenes remain interactive even with live data updates Animations, lighting, and heatmaps are computed efficiently Rather than relying on pre-rendered images or static textures, Zircon3D renders geometry and visual states dynamically, frame by frame. This is what allows: Smooth camera movement Real-time device state changes Continuous heatmap updates without freezing the UI Data-oriented scene design Zircon3D does not treat the 3D view as a decorative layer. The scene is directly driven by structured data, including: Rooms and spaces Devices and sensors Live state updates from Home Assistant Only the parts of the scene that actually change are updated. This avoids unnecessary recalculation and keeps performance predictable, even as systems grow. Separation of interaction logic and rendering Another key performance factor is architectural separation: Rendering logic is isolated from UI logic State updates are carefully scoped Expensive operations are minimized during interaction This makes actions like: Dragging objects Rotating the view Zooming in and out feel smooth and consistent, even on modest hardware. Why mobile and tablet interactions are currently more limited Zircon3D’s core engine performs well on phones and tablets. However, interaction is a separate challenge from rendering performance. On desktop: Mouse and keyboard provide precise control Complex gestures are easy to distinguish On mobile and tablets: Fingers are less precise Gestures overlap (drag vs pan vs rotate) Screen space is limited Accidental input is more likely Rather than shipping a compromised or frustrating editing experience, Zircon3D currently focuses mobile and tablet usage on: Viewing Monitoring Light interaction This is a deliberate design choice, not a technical limitation of the engine itself. Roadmap: hand-friendly interaction on tablets Tablet-first interaction requires different design thinking. Zircon3D’s roadmap includes: Larger, touch-optimized interaction zones Gesture-aware tools designed specifically for fingers Reduced precision requirements for placement and control Editing modes tailored for tablet usage rather than adapted from desktop This work is planned as a dedicated tablet experience, not a scaled-down desktop UI. High performance as a long-term commitment Performance in Zircon3D is not a one-time optimization. It is a guiding principle that affects: Rendering architecture Data flow design UI structure Feature decisions This is why Zircon3D can: Scale from small homes to complex environments Handle real-time data without freezing Remain responsive even as features grow In summary Zircon3D is high-performance because it is: A real-time system, not a static renderer GPU-accelerated by design Data-driven at its core Architected to minimize unnecessary work While editing on phones and tablets is currently limited by interaction constraints, the underlying engine is already capable and a tablet-friendly, hand-first experience is actively planned. Zircon3D is built not just to look good today, but to remain fast, reliable, and scalable as your system grows.
  • 0 Votes
    1 Posts
    4k Views
    Tami LiuT
    Which 3D Floorplan Tool Is Right for Home Assistant? https://youtu.be/DmW2T6G2TiU For years, many Home Assistant users relied on tools like Sweet Home 3D or traditional CAD software, powerful for drawing, but limited to static images that quickly fall out of sync with a live smart home. In 2026, the game has changed. This article compares Zircon3D with Sweet Home 3D and other popular floor-planning tools, and explains why Zircon3D was designed from the ground up for real-time visualization with Home Assistant. Sweet Home 3D - The “Static Hobbyist” Choice The workflow You design your house, render a nice image, then manually place invisible buttons or overlays in Home Assistant. The problem Even the smallest change, such as moving a lamp or adjusting a wall, requires re-rendering the entire scene from scratch. Simple layout tweaks can easily cost 20–30 minutes, turning quick experiments into a slow, frustrating workflow. What you end up with is a static picture of your home, not a live model that can evolve with your smart system. Your smart home evolves daily, but your floorplan stays frozen in time. Zircon3D advantage: Live interactivity Zircon3D uses a real-time WebGL engine. There’s no exporting and no re-rendering. Move a light, rename a room, or add a sensor and every connected dashboard updates instantly. Your home becomes a living model, not a snapshot. Floorplanner - The “Cloud Designer” The workflow A polished web-based tool with a large furniture library, excellent for interior design and real-estate mockups. The problem Floorplanner isn’t built for smart homes: There is no native integration with Home Assistant, making it difficult to connect real devices or automation data to the floorplan. Displaying live sensor values typically relies on screenshots, manual updates, or hacky workarounds that quickly become outdated. The tool has no concept of device state or animation, so lights, fans, and other devices can’t visually reflect their real-time behavior. It’s a design canvas, not a monitoring system. Zircon3D advantage: IoT-first DNA Zircon3D was designed from day one to work with Home Assistant. That’s why features like: Thermal heatmaps Real-time device state animation (fans spin, lights glow, heaters pulse) Room-aware dashboards are native concepts—not afterthoughts. Matterport - The “High-End Pro” The workflow Scan your house using a dedicated 360° camera and upload everything to a professional cloud service. The problem The overall cost is high, combining specialized scanning hardware with an ongoing subscription fee that can be hard to justify for home or small setups. All scans and models are stored and processed on external servers, meaning you don’t have direct control over where your data lives or how it’s handled. For many Home Assistant users, mandatory cloud storage and processing raise privacy concerns and become a deciding factor against adoption. It looks impressive, but comes with tradeoffs. Zircon3D advantage: Local-first privacy Zircon3D delivers a professional 3D experience without forcing your home data into the cloud. Your floorplan and sensor data stay inside your network, while still offering smooth visuals and real-time interaction. Other tools you might consider (and why they fall short) SketchUp - Powerful, but manual, static, and not automation-aware Planner 5D - Beautiful visuals, but no smart-home integration Traditional CAD tools - Accurate, but completely disconnected from live data All are great at drawing. None are great at living with your home. Why Zircon3D is different Zircon3D isn’t just a 3D floorplan tool, it’s a visualization layer for Home Assistant. Real-time 3D (not exported images) Native Home Assistant integration Heatmaps, dashboards, and device animations Local-first by default, cloud-optional Designed for monitoring, not staging If you want your floorplan to reflect what your home is doing right now, Zircon3D is built for that job. Zircon3D - The “Home Assistant–Native” Choice Zircon3D is a 3D visualization system designed specifically for Home Assistant, focusing on real-time interaction rather than static rendering. It offers a free account to get started, with affordable paid plans that are significantly lower than professional scanning or other design tools, making it practical for both home users and small facilities. Unlike traditional floor-planning apps, Zircon3D runs as a live WebGL engine, allowing layouts, devices, and sensor data to update instantly without re-exporting or re-rendering. It supports features like room-aware dashboards, heatmaps, and device state visualization, all while keeping performance smooth on everyday hardware. Most importantly for many Home Assistant users, Zircon3D follows a local-first design by default, keeping your floorplan and sensor data within your own environment, with cloud features remaining optional rather than mandatory. [image: 1768240845035-30c5f3a0-a3b5-40af-b901-c102001d96d0-image.png] In short If your goal is interior design or real-estate visuals, the classic tools still work well. If your goal is understanding, monitoring, and interacting with your smart home in real time, Zircon3D stands in a category of its own. Your home isn’t static anymore. Your floorplan shouldn’t be either.
  • The Importance of 3D Visualization in Smart Home Applications

    1
    1
    0 Votes
    1 Posts
    270 Views
    Tami LiuT
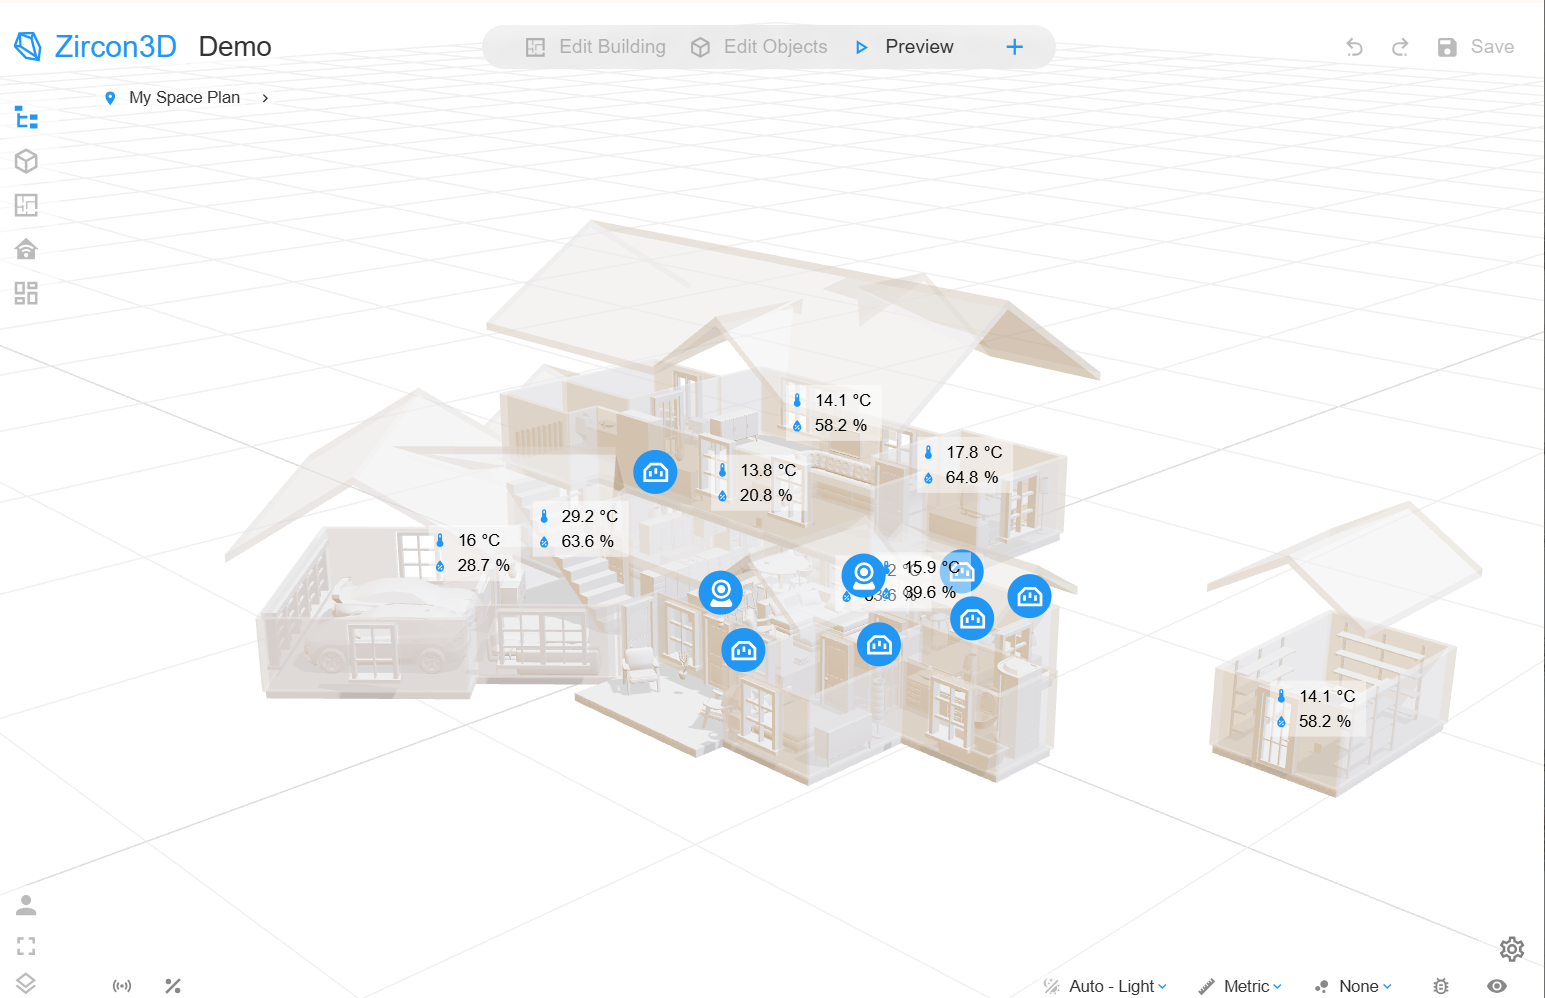
    The Importance of 3D Visualization in Smart Home Applications Smart home technology has revolutionized the way we interact with our living spaces. From controlling lighting and climate to monitoring security, smart devices offer an unprecedented level of convenience and automation. However, as the number of connected devices in a home increases, managing them effectively becomes a challenge. This is where 3D visualization comes into play, offering an intuitive, interactive, and spatially accurate way to monitor and control smart homes. Why 3D Visualization Matters for Smart Homes Traditional smart home dashboards often rely on lists, maps, or static 2D floor plans. While functional, these interfaces can be limiting when dealing with complex setups. A 3D visualization-based system enhances user experience in several ways: Spatial Awareness: A 3D floor plan accurately represents the layout of a home, allowing users to see the exact location of each smart device in relation to furniture, rooms, and walls. Enhanced Control: Instead of searching through menus, users can interact directly with a 3D-rendered environment, clicking on devices to toggle settings, view status, or make adjustments. Improved Troubleshooting: When an issue arises, knowing the precise location of a sensor or smart appliance can help diagnose problems faster. Better Planning and Optimization: When adding new devices, a 3D visualization provides a clear understanding of the space, ensuring optimal placement for smart home efficiency. Displaying and Controlling Smart Devices on a 3D Floor Plan A 3D floor plan takes smart home management to the next level by offering a visually intuitive way to interact with devices. Instead of reading through a list of sensors or scrolling through a 2D map, users can simply navigate a realistic digital twin of their home, selecting and adjusting devices in real time. Lighting & Climate Control: Adjust brightness, color temperature, or thermostat settings by clicking on lights and HVAC units in the 3D space. Security & Surveillance: View camera feeds, check door locks, and monitor motion sensors within a true-to-scale representation of the home. Energy Monitoring: Visualize energy consumption per room, floor, or specific appliances in an easy-to-understand format. Smart Appliances & IoT Devices: Control smart plugs, speakers, and other devices with a simple click or gesture, improving the overall automation experience. Heatmaps & Environmental Data: With advanced visualization, users can see thermal imaging, humidity levels, and air quality metrics directly on their 3D floor plan. Zircon3D: The Perfect 3D Visualization System for Smart Homes Among the available smart home visualization solutions, Zircon3D stands out as a unique and powerful system designed specifically to integrate with smart devices. What Makes Zircon3D Unique? Highly Realistic 3D Rendering: Unlike generic dashboards, Zircon3D provides an immersive and dynamic 3D floor plan that reflects real-world layouts with accuracy. Interactive Smart Device Control: Users can control their smart home by interacting directly with the 3D environment, making management more intuitive than ever. Heatmaps and Sensor Data Integration: Zircon3D supports visualizing temperature, humidity, air quality, and motion detection as real-time overlays on the floor plan. Multi-Platform Accessibility: The system is available on web and mobile, ensuring seamless control from any device. Scalability from Home to Business Use: Whether managing a single-family home or a commercial building, Zircon3D provides the flexibility to scale visualization needs effortlessly. The Future of Smart Home Interaction As smart home ecosystems grow more complex, 3D visualization will become an essential tool for homeowners and facility managers. By providing an intuitive, interactive, and visually engaging experience, Zircon3D bridges the gap between technology and usability, making smart home control accessible for everyone. [image: 1762380967196-003_w.png] If you're looking to enhance the way you interact with your smart home, Zircon3D offers the perfect solution—a powerful, scalable, and user-friendly 3D visualization platform designed for the future of smart living. Want to learn more? Visit https://zircon3d.com/ to explore how 3D visualization can revolutionize your smart home experience!
  • Visualize Your Smart Home with a Real-Time 3D Heatmap

    1
    1
    0 Votes
    1 Posts
    630 Views
    Tami LiuT
    Understanding the environment inside your home has never been more important — and more intuitive — than now. With Zircon3D, you can view real-time temperature and humidity heatmaps across your entire home in a fully interactive 3D floorplan. This feature goes far beyond traditional dashboards. It transforms your sensor data into a thermal layer you can see and feel — at a glance. [image: 1762380296195-72d3f8763a3e5d3afb06dc0f1dde8c16dd1b8fb2.gif] ️ Why a 3D Heatmap is Better Than Numbers Most smart home systems show environmental data as a list of temperature or humidity values per room. While functional, numbers require mental effort — you have to read, compare, and interpret them in context. But with a 3D heatmap, your brain does less work and sees more. The moment you look at your Zircon3D model, you’ll instantly spot: Hot or cold spots Humid zones (like kitchens, basements, or bathrooms) Areas with sensor failure or drop-off Rooms where climate control may be inefficient Color-coded layers mapped directly onto your 3D space make it obvious what’s happening in your home — no charts or tables required. 🧠 Color is a Language Your Brain Understands Humans evolved to read visual cues. A splash of red feels hot. Blue feels cold. We don’t need to "translate" a Celsius value when we see the heat right on the walls or floors of a room. In Zircon3D, each space is shaded based on sensor data pulled in real time from Home Assistant or your supported smart home platform. Whether you're glancing at your bedroom from your phone or exploring your basement from a tablet, the thermal layer gives you a natural, intuitive sense of space and comfort. ️ Built for Home Assistant — and More Zircon3D integrates seamlessly with Home Assistant via our Zircon3D Proxy add-on, letting you visualize all your temperature and humidity sensors automatically in your existing smart home setup. https://youtu.be/YMsyuJpP2RA And we’re not stopping there — Zircon3D is a standalone system as well, with planned support for additional platforms and OEM integrations. Whether you’re a smart home enthusiast or a developer building your own solution, Zircon3D can turn your raw data into an immersive experience. Use Cases Beyond Just Comfort Smart HVAC tuning: See where hot or cold zones exist and adjust vents or thermostats accordingly. Airflow analysis: Identify stagnant or poorly ventilated spaces. Sensor health: Quickly detect dropped or faulty sensors by the absence of data on the heatmap. Energy efficiency: Cross-reference the heatmap with insulation zones or external weather data. Experience It Yourself Your smart home is more than devices — it's a living, breathing environment. Zircon3D’s real-time heatmap feature helps you see it like never before. Try it now for FREE and bring your floorplan to life: https://zircon3d.com