
3D IoT Visualization: How Zircon3D Connects Real-Time Sensor Data to a Digital Twin
-
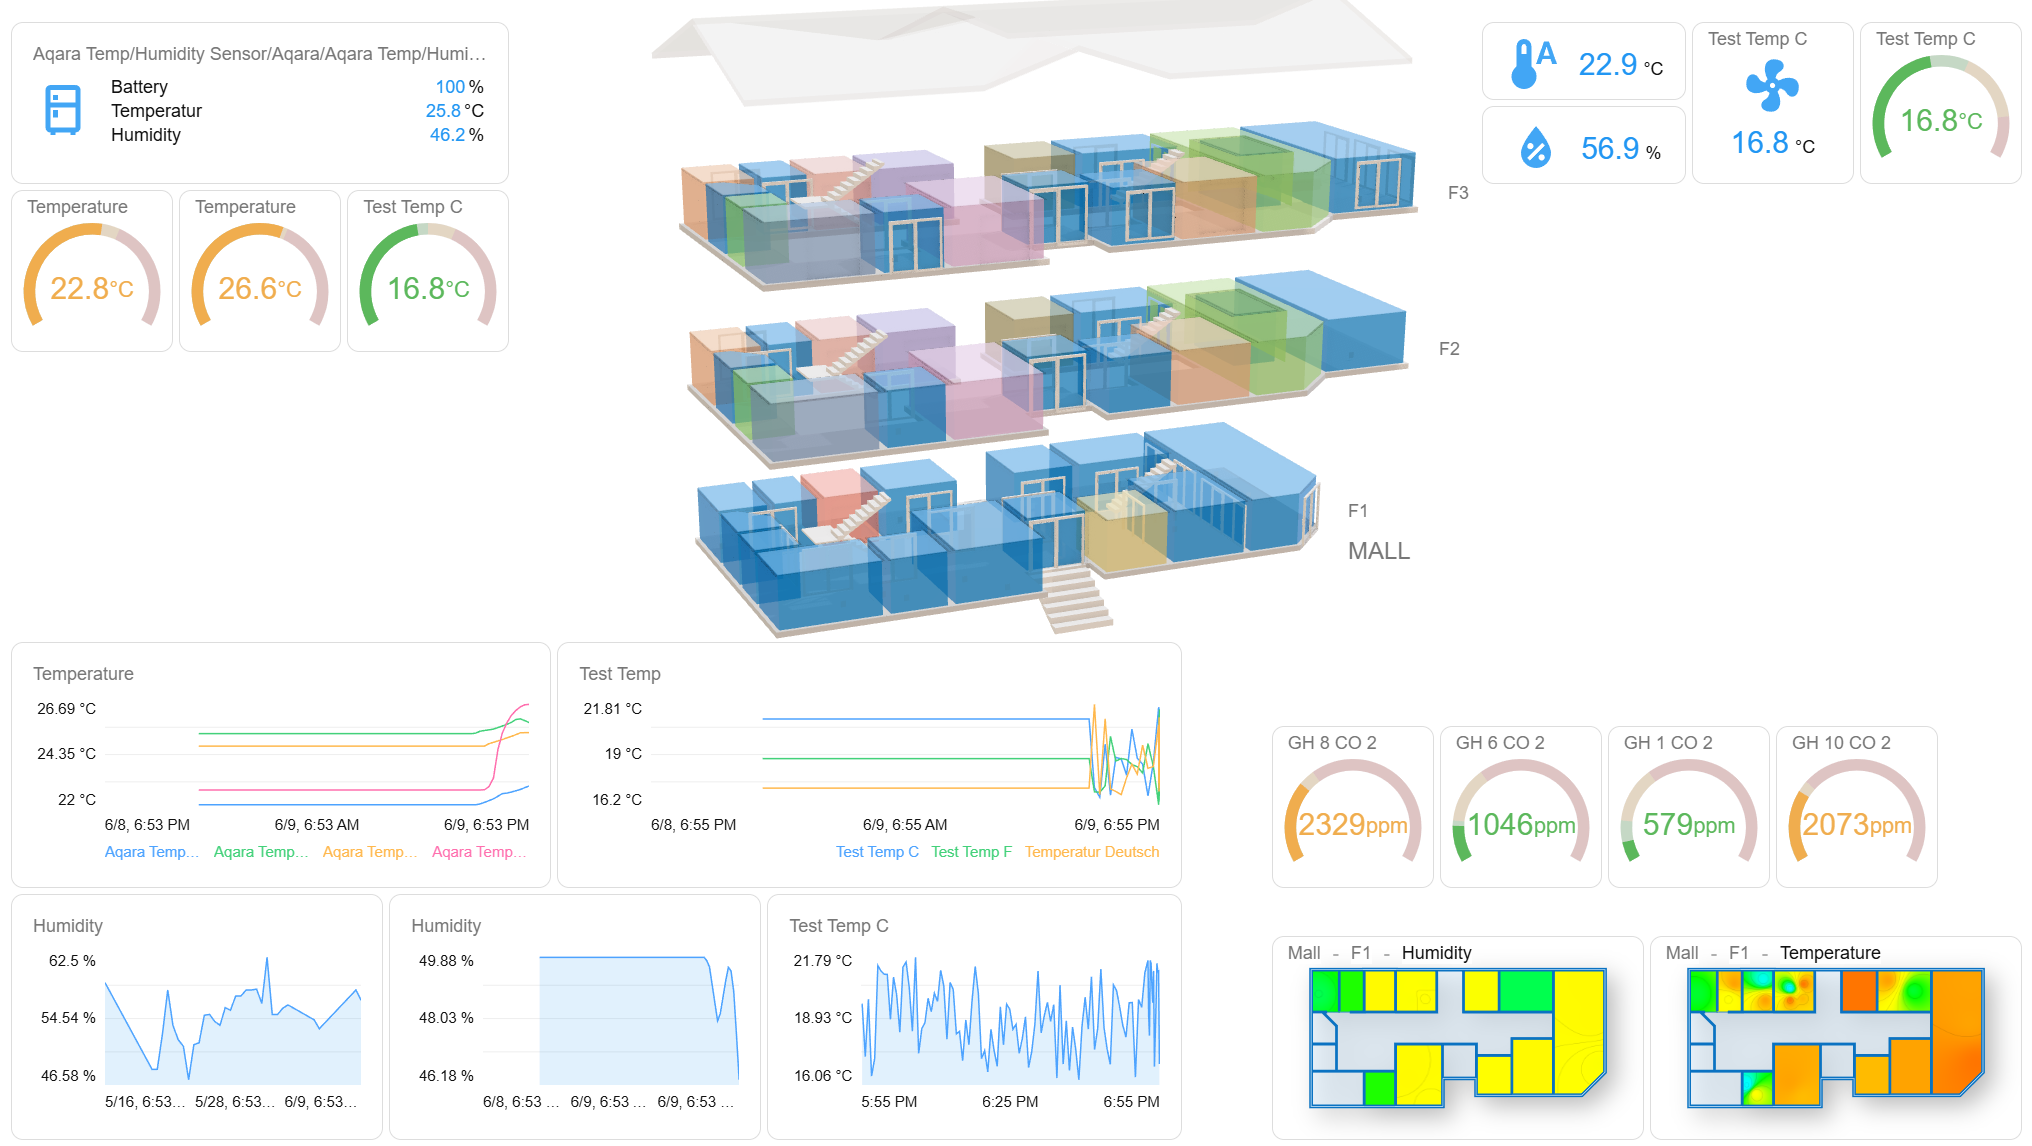
Learn how Zircon3D maps real-time IoT sensor data to interactive 3D models, heatmaps, dashboards, and digital twin views through Home Assistant.
Collecting IoT sensor data is usually not the hardest part of an IoT project.
Platforms such as Home Assistant, MQTT brokers, building management systems, gateways, and industrial controllers can already collect temperature, humidity, air quality, occupancy, energy, equipment status, and other measurements.
The more difficult question is:
How can we show real-time IoT sensor data in its actual physical location inside a 3D model?
A traditional IoT dashboard presents values through cards, charts, tables, and gauges. These are useful, but they often remove the spatial context of the data. A value may tell you that one sensor reports a high temperature, but it does not immediately show where that sensor is located, which room is affected, or what equipment is nearby.
A 3D IoT visualization adds this missing spatial context.
Instead of looking at an isolated list of sensor values, users can see the building, room, greenhouse, office, facility, or equipment layout and understand what is happening in the real environment.
This is the type of problem Zircon3D is designed to solve.
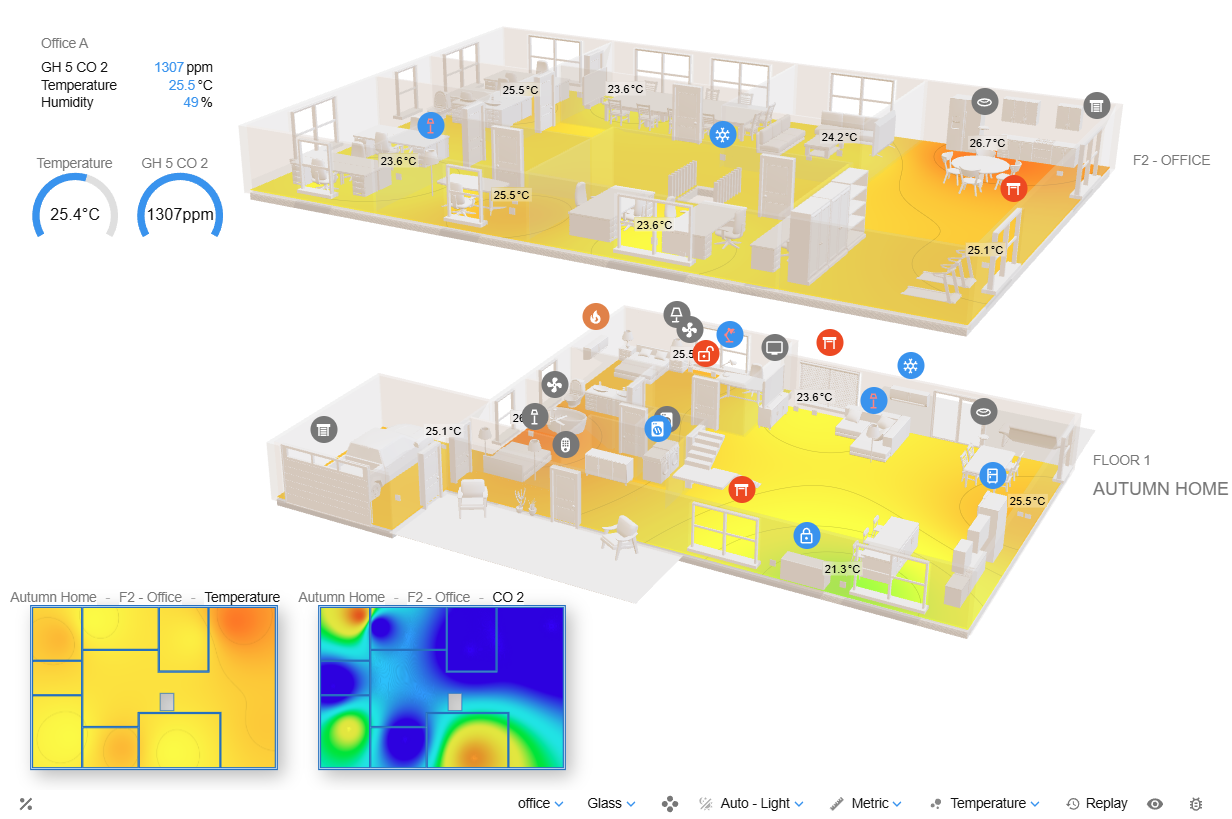
Zircon3D combines an interactive 3D environment with real-time IoT sensor data, heatmaps, dashboards, and device controlsWhat Is a 3D IoT Digital Twin?
The term “digital twin” can describe several different types of systems.
At the most advanced level, a digital twin may include engineering simulation, predictive models, structural analysis, physics calculations, maintenance planning, and lifecycle management.
However, many IoT projects have a more practical objective:
- Display a building or facility as an interactive 3D model.
- Place sensors and connected devices in their real locations.
- Show live values and device states.
- Highlight environmental conditions with heatmaps.
- Review historical changes.
- Control supported devices from the same interface.
This can be described as a visual or operational digital twin.
Its purpose is not to simulate every physical process. Its purpose is to create a live spatial view of the real environment so that operators can understand conditions more quickly.
Zircon3D focuses on this visualization layer.
The Traditional Way: Building a Custom 3D IoT Application
A developer building a 3D IoT visualization from scratch may consider a technology stack such as:
- Blender for creating the 3D model.
- glTF or GLB for exporting the model.
- Three.js, Babylon.js, or Unity for rendering.
- MQTT or WebSocket for real-time communication.
- A backend service for authentication and device mapping.
- A database for current and historical sensor values.
- Custom shaders, labels, charts, and user-interface components.
- Custom code to associate sensor IDs with objects in the 3D scene.
This approach offers complete control, but it can quickly become a large software-development project.
Rendering a model is only the beginning. The application must also manage camera controls, model optimization, device synchronization, data mapping, sensor history, user permissions, mobile performance, dashboards, error handling, and deployment.
For a research project or highly specialized industrial application, custom development may be appropriate. For a smart home, greenhouse, office, school, laboratory, farm, or small facility, building all of these components from the beginning may not be necessary.
Zircon3D provides these capabilities as a ready-to-use visualization platform.
Creating the 3D Environment
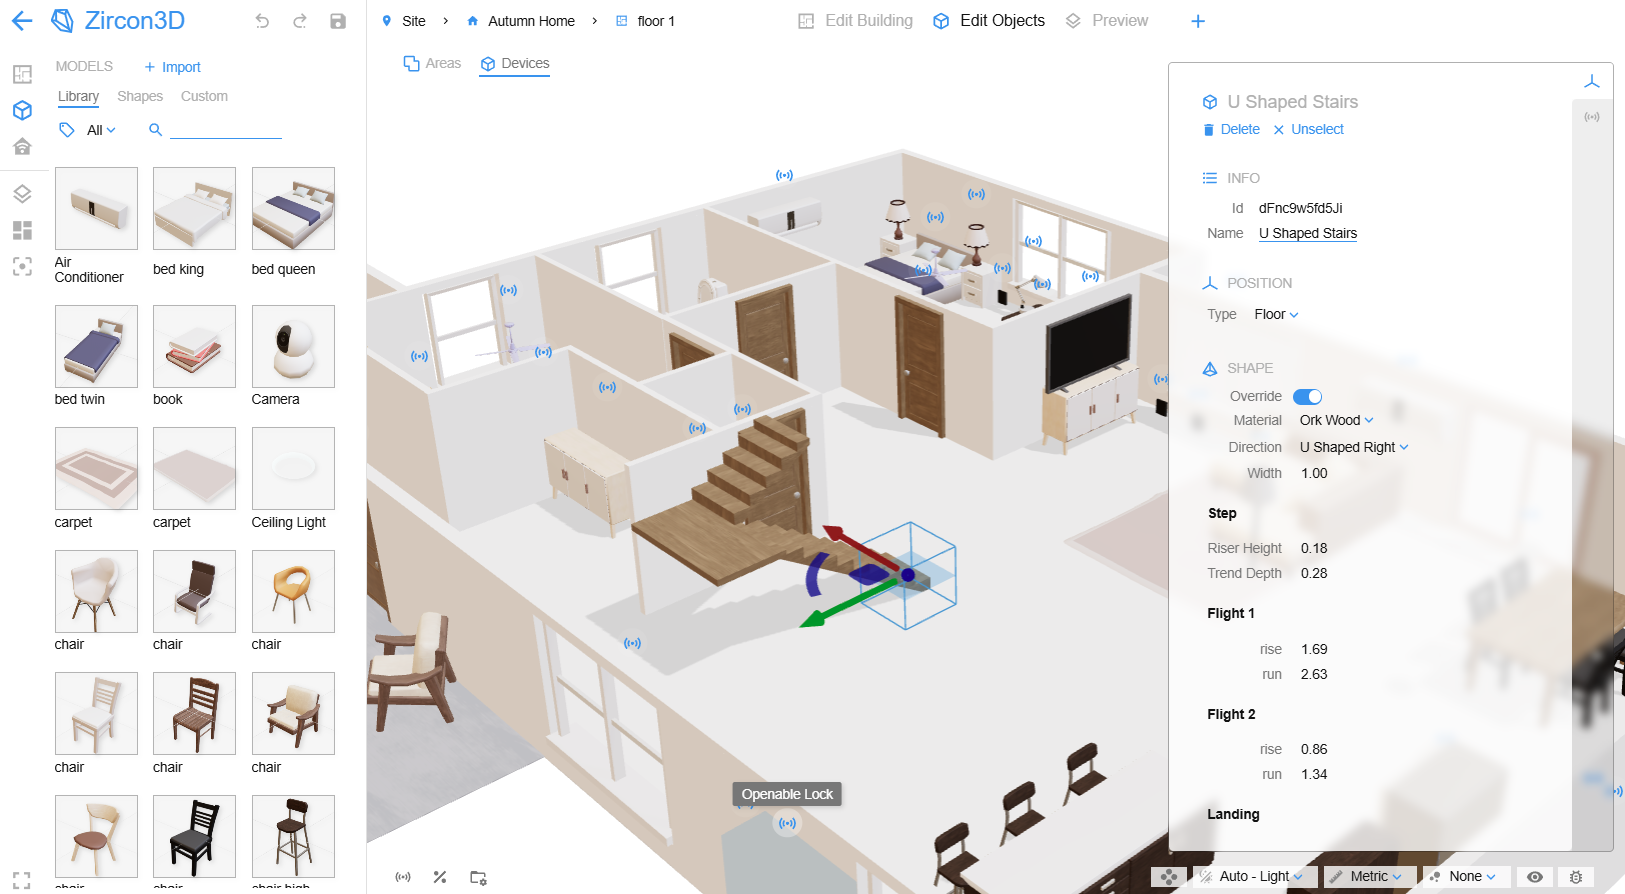
Zircon3D includes a visual designer for creating buildings, floors, walls, rooms, doors, windows, furniture, and other objects.
Users do not need to create the entire building in Blender or write code to display it. The floorplan can be created directly in the Zircon3D Designer.
For specialized assets, users can also upload their own
.glbmodels. This makes it possible to add custom equipment, machinery, furniture, greenhouse components, facility assets, or other objects that are not available in the standard model library.Simple resizable objects can also be used as equipment blocks, platforms, partitions, cabinets, tables, storage areas, or placeholders.
This provides two ways to build a scene:
- Create the building and its rooms directly in Zircon3D.
- Add custom GLB models for specialized equipment or visual details.
How Sensor Data Is Mapped to the 3D Model
One of the most important questions in a digital twin project is how to associate a sensor with the correct location or object.
In a custom Three.js or Unity application, this normally requires manually assigning identifiers to meshes or scene objects and then writing code that updates those objects when new data arrives.
Zircon3D uses a visual mapping workflow instead.
After devices and entities are imported from Home Assistant, a user can position a monitored device at its real location inside the 3D floorplan. Its entities can then be used by different visualization components.
For example, a temperature sensor can be:
- Positioned in the room where it is installed.
- Displayed through a floating information card.
- Included in a temperature heatmap.
- Added to a dashboard.
- Included in a saved monitoring view.
- Used during historical heatmap replay.
The same approach can be used for humidity, air quality, carbon dioxide, energy, occupancy, battery level, equipment state, and other numeric or status-based entities.
This means the relationship between the physical world and the digital model is created visually rather than through custom mesh scripting.
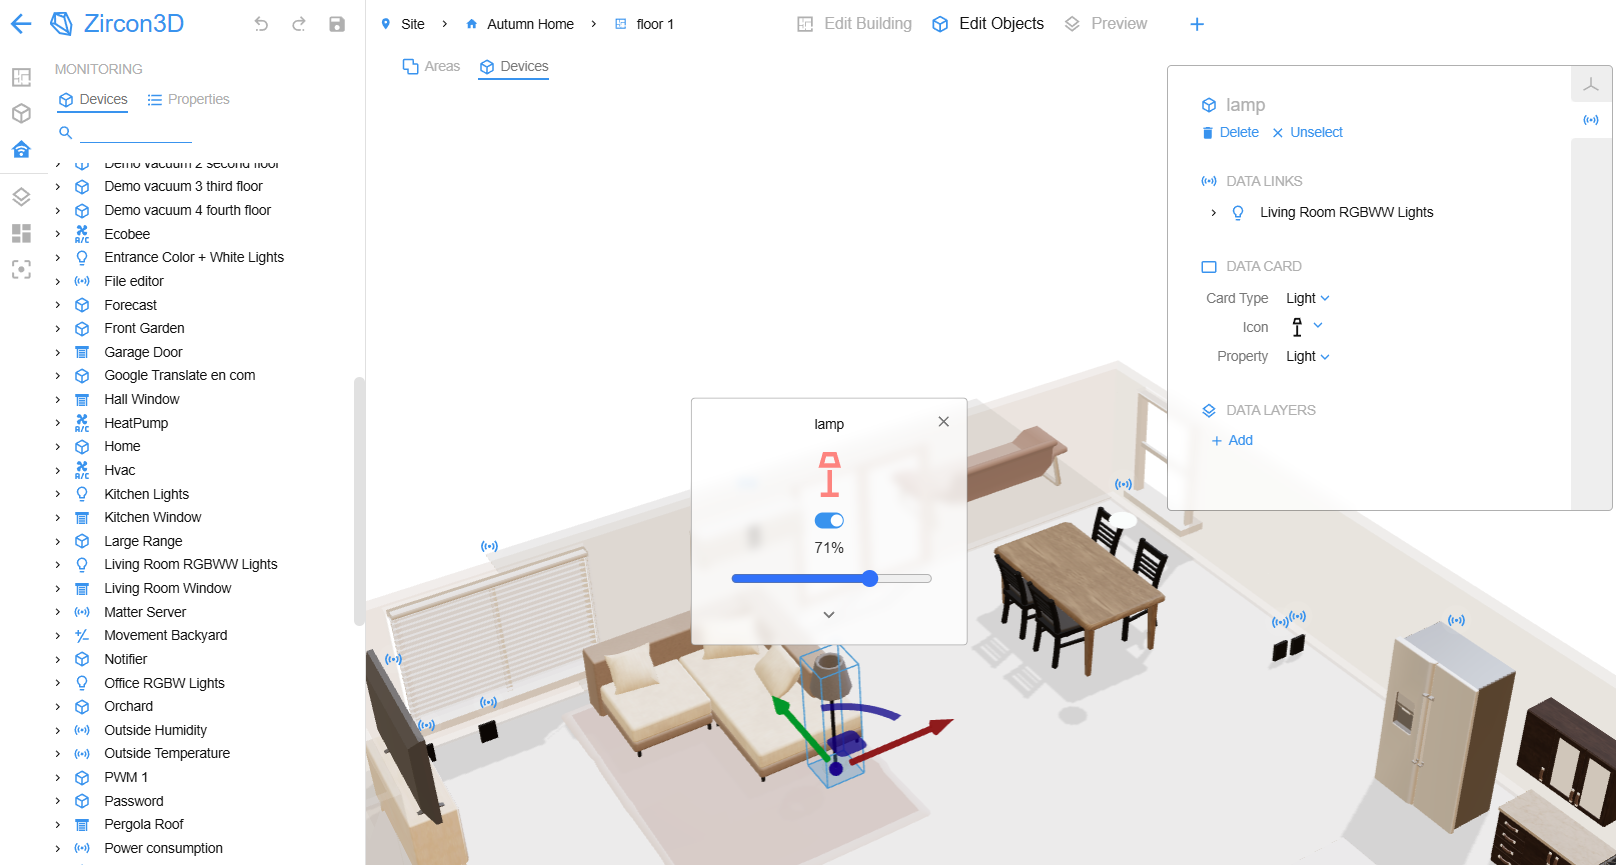
Sensors and Home Assistant entities can be positioned visually at their real locations inside the 3D floorplan.
Handling Real-Time IoT Sensor Data
Zircon3D currently integrates with Home Assistant, which acts as the IoT integration and device-management layer.
Home Assistant collects data from connected devices and exposes them as devices and entities. Zircon3D imports those entities and receives their state changes through a local proxy service.
When a value changes in Home Assistant, the corresponding Zircon3D visualization can update automatically.
These updates can appear in several forms:
- A new numeric value on a floating sensor card.
- A change in a device’s on/off state.
- A status indicator showing that a door, window, or lock is open.
- A changing color or pattern in a heatmap.
- An updated dashboard gauge, value card, or chart.
- A control card reflecting the current state of a device.
The visualization therefore remains connected to the real environment rather than becoming a static 3D rendering.
Can Zircon3D Visualize MQTT Sensor Data?
Zircon3D does not currently require users to connect it directly to every individual IoT protocol.
Instead, Home Assistant provides the integration layer.
When an MQTT sensor is configured in Home Assistant and exposed as an entity, Zircon3D can use that entity in the same way as other Home Assistant data.
A typical data flow can therefore look like this:
IoT sensor → MQTT broker → Home Assistant → Zircon3D
This separation keeps the responsibilities clear:
- The device platform or MQTT broker transports the sensor data.
- Home Assistant manages integrations, entities, and device states.
- Zircon3D provides the interactive 3D visualization.
Users do not need to create a separate MQTT-to-Three.js application simply to place live sensor values inside a building model.
More Than Sensor Labels: Spatial Heatmaps
Displaying a value above a sensor is useful, but it still represents only one measurement point.
Heatmaps provide a broader understanding of how conditions change across a space.
Zircon3D can map multiple sensors into a heatmap layer and display the estimated distribution of a quantity across the floorplan.
Common examples include:
- Temperature distribution across rooms.
- Humidity differences inside a greenhouse.
- Carbon-dioxide levels in classrooms or offices.
- Air-quality conditions across a facility.
- Wi-Fi signal strength.
- Custom numeric sensor measurements.
This helps answer questions that are difficult to understand from a table:
- Which part of the building is becoming too warm?
- Is humidity concentrated in one greenhouse zone?
- Are environmental conditions consistent between rooms?
- Which area changes first when the HVAC system starts?
- Where are additional sensors needed?
Heatmap replay can also be used to examine how conditions changed over a selected period, adding a time dimension to the 3D IoT visualization.
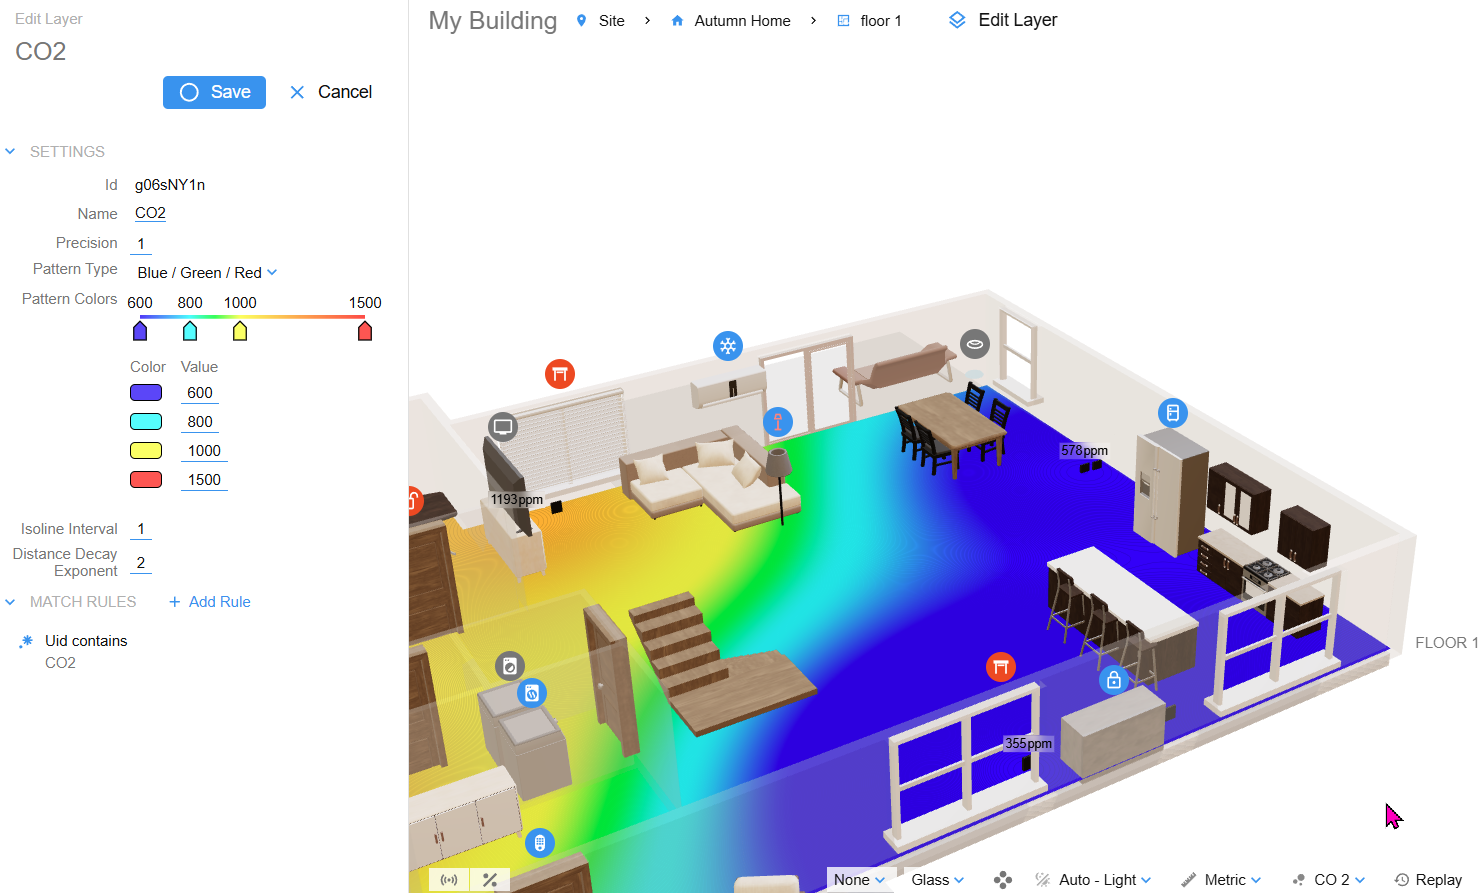
Spatial heatmaps make it easier to understand how temperature, humidity, air quality, and other measurements vary across the environment.
Combining 3D Visualization with IoT Dashboards
Not every value is best represented directly on the model.
A good monitoring interface combines spatial visualization with conventional dashboard components.
Zircon3D allows dashboards to be displayed together with the 3D scene. A monitoring view can therefore include:
- The interactive building model.
- Floating sensor values.
- Environmental heatmaps.
- Gauges and value cards.
- Historical charts.
- Device status indicators.
- Control cards.
- Saved camera and display settings.
The 3D model answers where something is happening, while the dashboard provides detailed values and trends.
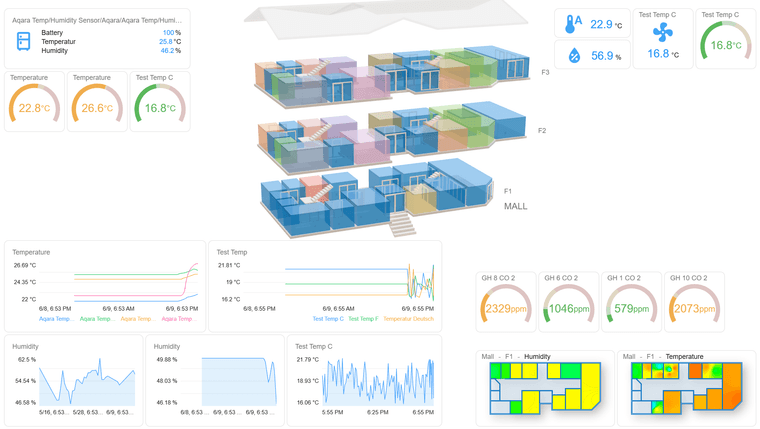
The 3D model explains where an event is happening, while dashboard cards provide detailed values and trends.
Monitoring and Controlling Connected Devices
A digital twin does not have to be view-only.
Zircon3D supports control cards for compatible Home Assistant entities, including lights, switches, covers, climate devices, locks, and fans.
A user can select a device in its physical location and access the relevant controls. Depending on the device, this may include:
- Turning a light or switch on and off.
- Adjusting light brightness or color.
- Opening or closing a cover.
- Changing a thermostat setting.
- Controlling a fan.
- Locking or unlocking a supported lock entity.
Commands are sent through Home Assistant rather than directly from Zircon3D to the physical device.
This allows Zircon3D to remain a visualization and interaction layer while Home Assistant continues to manage device communication and automation.
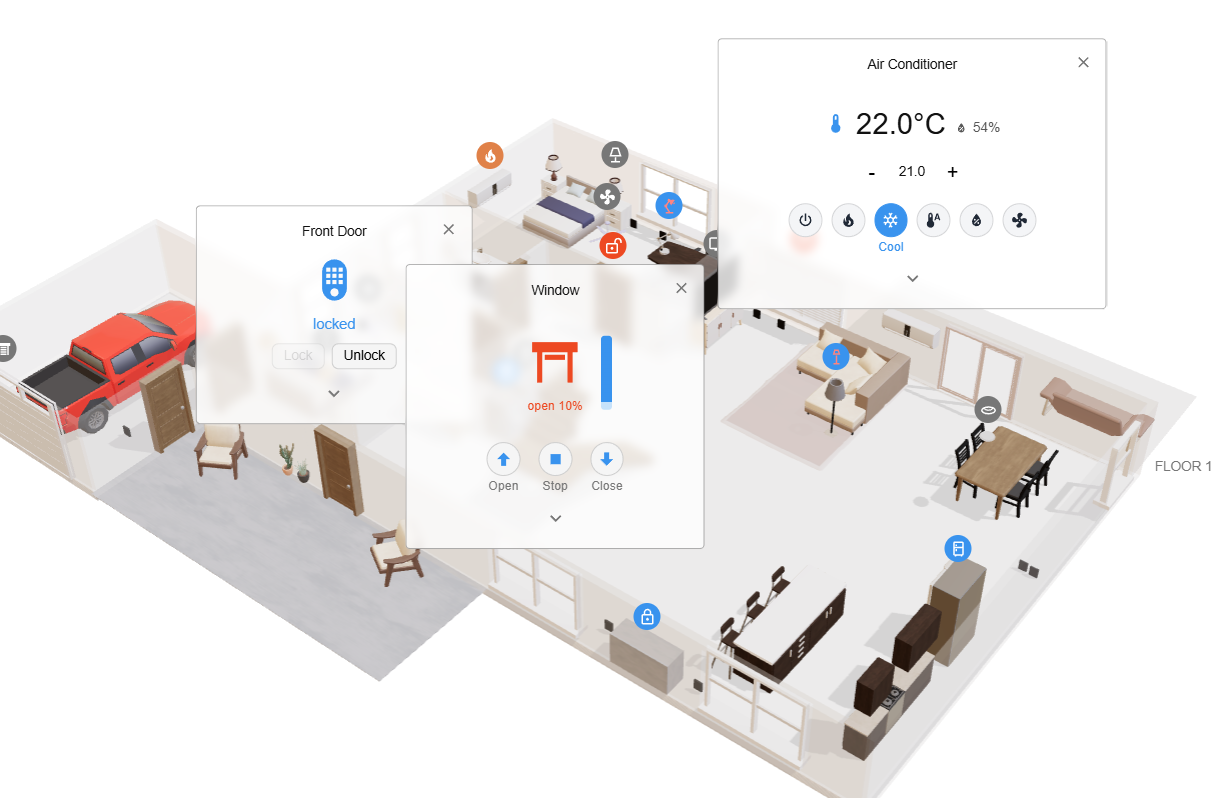
Supported Home Assistant devices can be monitored and controlled from their physical locations in the 3D model.
Local-First IoT Data and Privacy
Privacy is an important consideration for smart buildings and digital twins.
When Zircon3D is installed through the Home Assistant add-on or Docker service, communication with Home Assistant occurs locally.
Sensor readings, device states, and locally stored monitoring history remain on the user’s own system. Zircon3D Cloud is used for account and license management rather than storing live Home Assistant monitoring data.
This local-first architecture can be useful for:
- Private homes.
- Schools and educational projects.
- Small businesses.
- Farms and greenhouses.
- Laboratories.
- Facilities with sensitive operational data.
- Installations with limited internet connectivity.
The visualization can continue to operate as part of the local environment without sending every sensor update to an external IoT visualization service.
What Zircon3D Is and What It Is Not
Zircon3D is best suited to spatial monitoring and interaction.
It can show where sensors and devices are located, visualize their current values, present environmental heatmaps, display historical information, and provide supported device controls.
It is not intended to replace specialized engineering tools for:
- Finite-element analysis.
- Structural deformation simulation.
- Computational fluid dynamics.
- Mechanical stress analysis.
- Physics-based equipment simulation.
- Predictive engineering models.
For a digital twin that must simulate how pressure physically deforms a machine component, specialized engineering software or a custom application may still be required.
For a digital twin that needs to show the current pressure, temperature, position, alarm state, or operating condition of equipment inside a building or facility, Zircon3D can provide the visualization layer without requiring a new application to be developed from scratch.
A Practical Workflow for Building a 3D IoT Visualization
A basic Zircon3D project can follow this process:
1. Connect sensors to Home Assistant
Configure the IoT devices and confirm that their values appear as Home Assistant entities.
2. Create the building or facility layout
Use Zircon3D Designer to create floors, rooms, walls, doors, windows, and important physical areas.
3. Add equipment and custom models
Use built-in objects, resizable simple objects, or uploaded GLB models to represent important equipment and assets.
4. Position monitored devices
Place each sensor or device at the location that corresponds to its installation in the real environment.
5. Map the sensor data
Display the entities through floating cards, dashboards, heatmap layers, status indicators, or saved monitoring views.
6. Create operational views
Save different camera positions and visualization settings for purposes such as environmental monitoring, security, energy, equipment status, or executive overview.
7. Display the visualization
Open Zircon3D directly or embed a saved view inside a Home Assistant dashboard.
This process creates a practical digital twin without requiring users to build their own 3D engine, WebSocket service, device-mapping database, and visualization interface.
Frequently Asked Questions
Do I need Three.js or Unity to build a 3D IoT dashboard?
Not necessarily. These tools are useful for completely custom applications, but Zircon3D provides a ready-made 3D visualization environment for buildings, rooms, sensors, and Home Assistant entities.
Can I use a model created in Blender?
Yes. Custom assets can be exported from Blender in GLB format and uploaded to Zircon3D. The building layout can also be created directly with the Zircon3D Designer.
How do I connect a sensor to a specific location?
Import the sensor entity from Home Assistant, mount the monitored device in the 3D floorplan, and position it at the corresponding physical location. Its values can then be shown through cards, heatmaps, dashboards, and monitoring views.
Does Zircon3D support real-time sensor updates?
Yes. Changes received from Home Assistant can automatically update the 3D view, sensor cards, dashboards, and heatmaps.
Can it visualize MQTT data?
Yes, when the MQTT sensor or device is configured as an entity in Home Assistant. Zircon3D uses the entity exposed by Home Assistant rather than connecting separately to the MQTT broker.
Does it require a cloud IoT platform?
No external cloud IoT platform is required for Home Assistant monitoring. The Zircon3D proxy can run locally as a Home Assistant add-on or Docker service, and monitoring data stays within the local environment.
Is Zircon3D only for smart homes?
No. The same approach can be used for greenhouses, farms, offices, schools, laboratories, workshops, equipment rooms, and small or medium-sized facilities.
A More Accessible Approach to 3D IoT Visualization
Building a digital twin no longer has to begin with selecting a game engine and creating an entire custom software stack.
When the objective is to visualize real-time sensor data in its physical context, Zircon3D provides a more direct approach:
- Create an interactive 3D building model.
- Position sensors and devices in their real locations.
- Connect live Home Assistant entities.
- Display values, states, dashboards, and heatmaps.
- Review historical environmental changes.
- Control supported devices.
- Keep monitoring data local.
The result is a practical 3D IoT visualization that connects the digital model with the real environment while reducing the development work normally required.
Explore Zircon3D, read the documentation, or join the Zircon3D community to learn more.
