See Temperature Differences Across Your Home in 3D (Temperature Delta Heatmap)
-
Turn Derived Data into Real Spatial Insight with Zircon3D
Understanding how well your HVAC system performs is not just about reading temperatures, it’s about seeing how conditions vary across your entire space.
With Zircon3D, you can go beyond raw sensor data and visualize derived values like Temperature Delta directly on your 3D floorplan.
What is Temperature Delta?
Temperature Delta = |Actual Temperature − Target Temperature|
This value shows how far each area is from its desired condition:
- Small difference → Comfortable & balanced
- Large difference → Struggling to reach target
Why this matters
A Temperature Delta heatmap helps you instantly identify:
- Rooms that are too slow to heat or cool
- Areas with poor airflow or distribution
- Zones affected by insulation or layout issues
- Imbalance across floors or large spaces
Instead of guessing, you can see the problem in seconds.
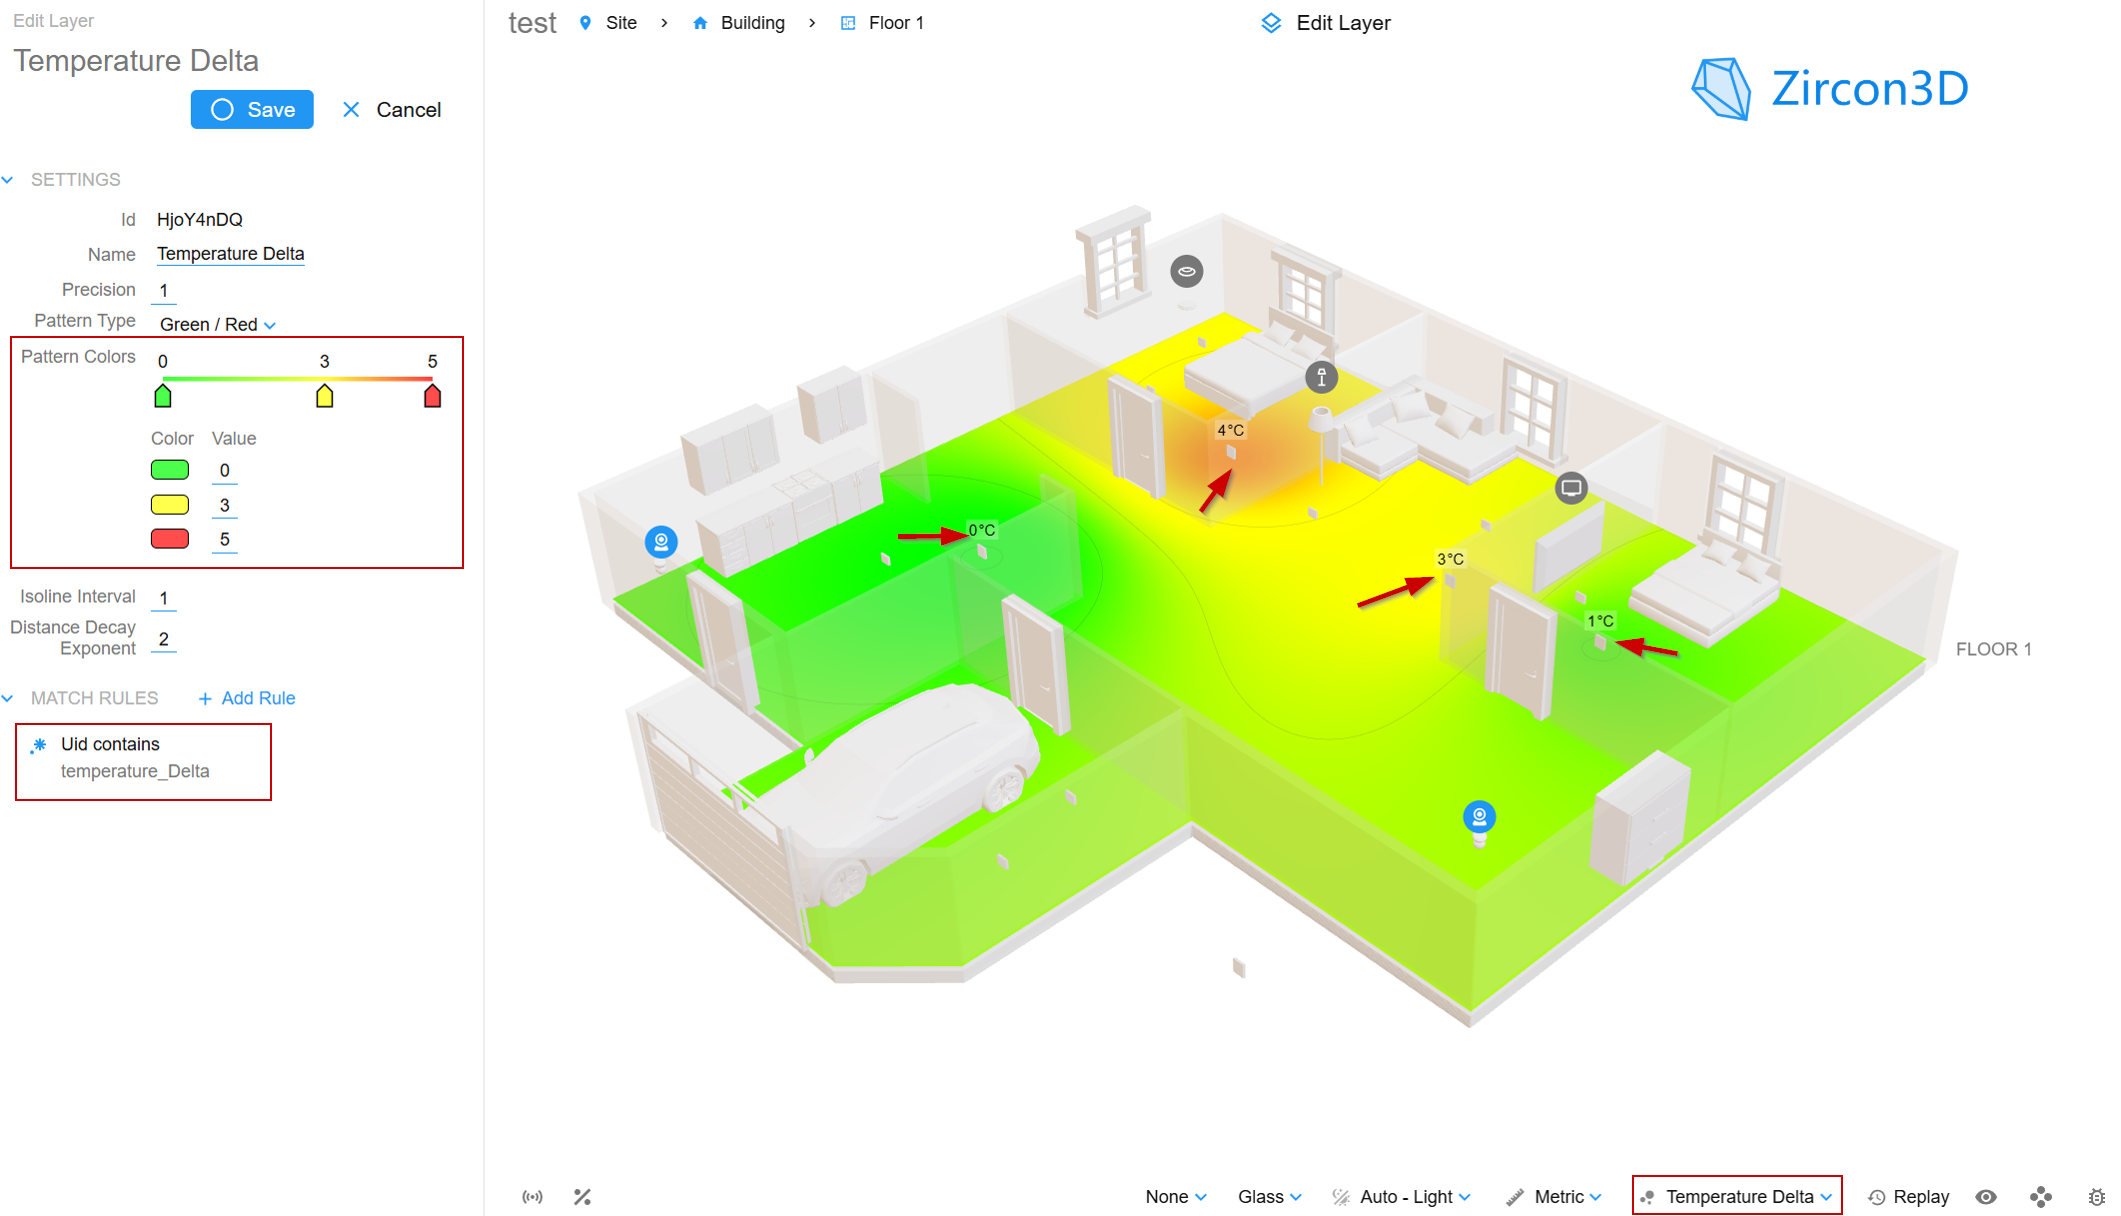
Example: Temperature Delta Heatmap
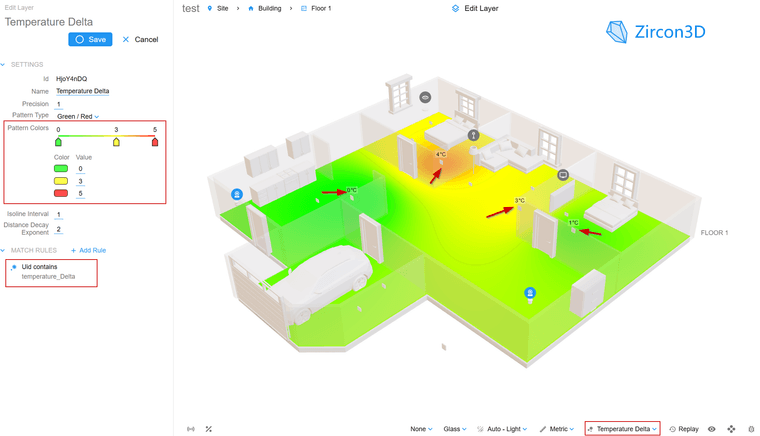
In this example:
The bedroom shows a 4°C difference, highlighted in orange/red which indicating the room is struggling to reach its target temperature.
Nearby areas around 3°C (yellow) suggest moderate deviation.
Green zones (0–1°C) indicate rooms that are well balanced and comfortable
This kind of visualization makes it easy to spot HVAC distribution issues at a glance, especially in multi-room layouts.
From Raw Data to Insight
This example highlights a powerful capability of Zircon3D:
You can visualize computed data, instead of just raw sensors
Using a template sensor in Home Assistant, you can define your own metrics, such as:
- Temperature Delta heatmap (this example)
- VPD (Vapor Pressure Deficit) heatmap for greenhouses
- Energy usage heatmap per area
- Occupancy density heatmap
- Air quality indicators
Then, render them as a 3D heatmap.
Key Features Demonstrated
 ️ Support for user-defined data (template sensors)
- ️ Flexible entity matching (e.g., by name prefix)
- ️ Real-time 3D heatmap visualization
- ️ Works with existing HVAC / climate entities
- ️ Scales easily across multiple rooms
How It Works
1. Create a Template Sensor in Home Assistant
template:
  - sensor:
      - name: "Living Room Temperature Delta"
        unique_id: "living_room_temperature_delta"
        unit_of_measurement: "°C"
        state: >
          {{ (
              state_attr('climate.living_room', 'current_temperature')
              - state_attr('climate.living_room', 'temperature')
            ) | abs | round(1) }}
This calculates the difference between current and target temperature, and ensures it is always positive and easy to visualize.
2. Create a Heatmap in Zircon3D
- Add a new heatmap layer (e.g., Temperature Delta)
- Select your template sensors
- Use matching rules (e.g.,
uid contains temperature_delta) to automatically include multiple rooms
3. Configure Color Range
Example:
- 0°C → Green (good)
- 3°C → Yellow (moderate)
- 5°C → Red (needs attention)
Lower values indicate better comfort.
4. Assign Devices to the Floorplan
- Place your HVAC / climate devices in the 3D view
- Or update existing devices to use the new heatmap
5. View the Result
Switch to the heatmap layer and instantly see temperature differences across your space.
Why This is Powerful
This is more than a visualization, it’s a data-driven spatial analysis tool.
You are not limited to built-in metrics. With Zircon3D, you can:
- Define your own logic
- Compute custom values
- Visualize them in 3D space
Turning your system into a true 3D data dashboard
Learn More
- Get started with Zircon3D: https://zircon3d.com
- Documentation: https://zircon3d.com/docs
- Community forum (support & discussions): https://forum.zircon3d.com
- YouTube tutorials: https://www.youtube.com/@Zircon3D
- Join our Facebook group (updates & previews): https://www.facebook.com/groups/zircon3d
What’s Next?
This is just one example of what’s possible.
We’re continuing to expand support for:- More advanced derived metrics
- Better visualization layers
- Business and enterprise use cases
Have ideas or use cases? Let us know, your feedback directly shapes future features.