How to Create a Heatmap with Custom (Pre-Processed) Data in Zircon3D
Tutorials & FAQ
1
Posts
1
Posters
80
Views
1
Watching
-
Zircon3D allows you to visualize not only raw sensor data, but also custom computed values using tools like Home Assistant template sensors.
This guide shows how to create a Temperature Delta heatmap, but the same approach works for any custom metric.
What is “Pre-Processed Data”?
Pre-processed data means:
Data that is calculated or transformed before visualization
Examples:
- Temperature Delta (current vs target)
- VPD (humidity + temperature)
- Energy efficiency metrics
- Custom scoring or alerts
Step 1 Create a Template Sensor
In Home Assistant:
template:
  - sensor:
      - name: "Living Room Temperature Delta"
        unique_id: "living_room_temperature_delta"
        unit_of_measurement: "°C"
        state: >
          {{ (
              state_attr('climate.living_room', 'current_temperature')
              - state_attr('climate.living_room', 'temperature')
            ) | abs | round(1) }}
Repeat for other rooms with consistent naming.
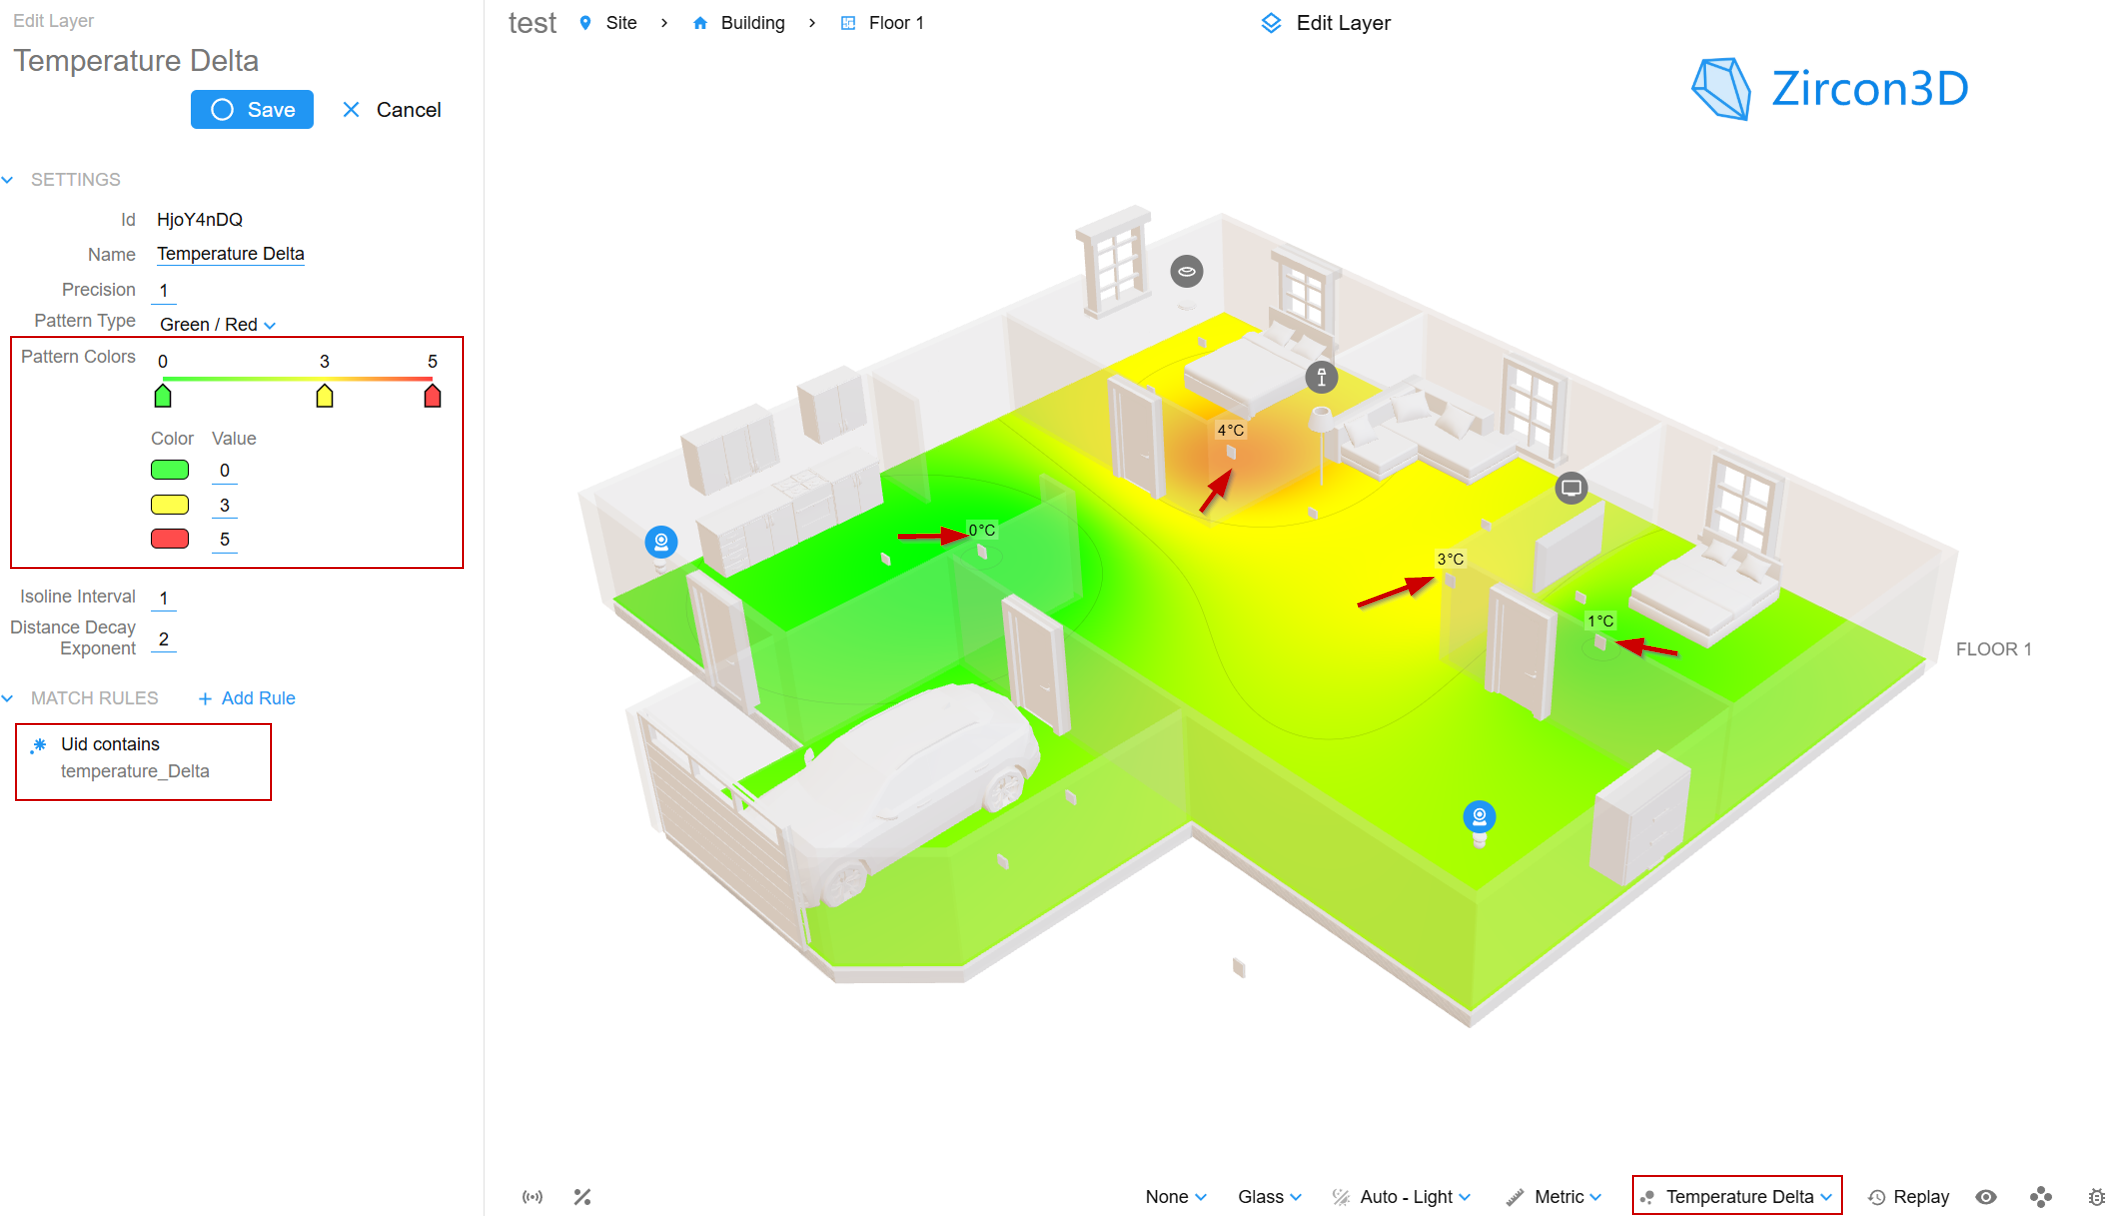
Step 2 Create a Heatmap in Zircon3D
- Add a new heatmap layer
- Name it (e.g., Temperature Delta)
- Select your template sensors
Step 3 Use Matching Rules (Recommended)
To scale easily across rooms:
- Use a rule like:
uid contains temperature_delta
This automatically includes all matching sensors.
Step 4 Configure Color Mapping
Example:
- 0°C → Green (good)
- 3°C → Yellow (moderate)
- 5°C → Red (needs attention)
Lower values = better comfort
Step 5 Assign Devices to Floorplan
- Place climate/HVAC devices in your 3D layout
- Or update existing ones to use the heatmap
Step 6 View the Heatmap
Switch to the heatmap layer to see your data visualized in 3D.
Beyond Temperature Delta
You can apply this method to:
- Greenhouse climate (VPD, humidity)
- Energy usage per zone
- Occupancy and utilization
- Air quality metrics
 Related
- Main article: See Temperature Differences Across Your Home in 3D
- Docs: https://zircon3d.com/docs