[From Old Forum] Cannot find my sensors
-
-
In my Setup it is the same. The connection is every second activated and deaktivated...any solutions for this?
@Hacker182 Hi, this is a known issue in certain setups, and it’s usually related to how the connection is made rather than a problem with your sensors or configuration.
In most cases, this happens when Zircon3D is accessed through Home Assistant Cloud (Nabu Casa). The cloud ingress can cause unstable WebSocket connections, which makes the status toggle between connected and disconnected.
What you can try:
Access Zircon3D locally instead of through HA Cloud:
http://homeassistant.local:11200/
(or use your HA server’s IP with port 11200)If you’re running HA in a VM or behind a firewall, make sure port 11200 and WebSocket traffic are allowed.
When accessed locally, the connection should stay stable and devices should load normally. We’re actively looking into ways to improve this behavior for cloud access in future updates.
-
@Tami-Liu Hi, first of all, thank you for your quick response. I was able to discuss the problem. I just don't have any sensors when I edit using your web designer. Editing with sensors works perfectly in my network. Do I need to open a specific port for web editing?
Now to your questions. No, I edit everything locally and I can continue editing via port 11200. Home Assistant has a cloud connection, but only for when I'm on the go. And yes, HA runs under Proxmox in a VM, but everything works perfectly now.
Thank you very much again. -
Okay, now i have the problem that my connection in HA connected and disconnected. As a result, my lights cannot be switched and no heat map is displayed.
Port 11200 is enabled in my firewall and accessible from outside. Are there any additional ports required for communication? My integration in HA now shows the same behaviour as the WebDesigner.
Many thanks in advance. -
Okay, now i have the problem that my connection in HA connected and disconnected. As a result, my lights cannot be switched and no heat map is displayed.
Port 11200 is enabled in my firewall and accessible from outside. Are there any additional ports required for communication? My integration in HA now shows the same behaviour as the WebDesigner.
Many thanks in advance.@Hacker182 Thanks for the detailed explanation, this helps a lot.
Just to clarify how things currently work, the Zircon3D Web Designer (cloud) does not connect directly to Home Assistant due to privacy concerns, and it only stores floorplan layout information. Because of this, when you are editing in the web designer, you won’t see HA sensors under the Monitoring tab, lights won’t switch, and heatmaps won’t work. This is expected behavior, there is no live HA data connected in the web designer. All data visualization and live interaction (sensors, lights, heatmaps) currently work only through the Zircon3D Home Assistant add-on, where Zircon3D runs locally and talks directly to HA.
From what you described, your setup is essentially working in local-only mode. However, when HA Cloud is enabled and the system keeps switching between connected / disconnected states, this can lead to unstable data flow, which explains what you described, that lights not switching, heatmaps not displaying and the HA integration showing the same behavior as the web designer. This is not related to missing ports. Only port 11200 is required for local access, and no additional ports are needed for normal operation.
Here are some recommended approach for now:
- Use the HA add-on UI (local) for monitoring, switching lights, and heatmaps
- Use the web designer only for layout/design floorplan work
- If stability issues persist (connected / disconnected), please try temporarily disabling HA Cloud to confirm the connection remains stable locally. When accessed locally, the connection should stay stable and devices should load normally. We’re actively looking into ways to improve this behavior for cloud access in future updates. but for now this separation between cloud design and local visualization is by design.
If you’d like, please share a short log snippet from the moment the connect/disconnect happens, it will help us investigate and improve.
-
HA Add-on log
Home Assistant → Settings → Add-ons → Zircon3D Proxy → Log tab
Please copy the log lines around the time you see the disconnect/reconnect. -
Web browser log (DevTools)
a. Open Home Assistant in your web browser
b. Go to Zircon3D → Monitoring tab
c. Press F12 to open Developer Tools
d. Refresh the page (so we capture the full reconnect process)
e. In DevTools, click the download/export button (as shown in the screenshot) to save the log file, then send it to us.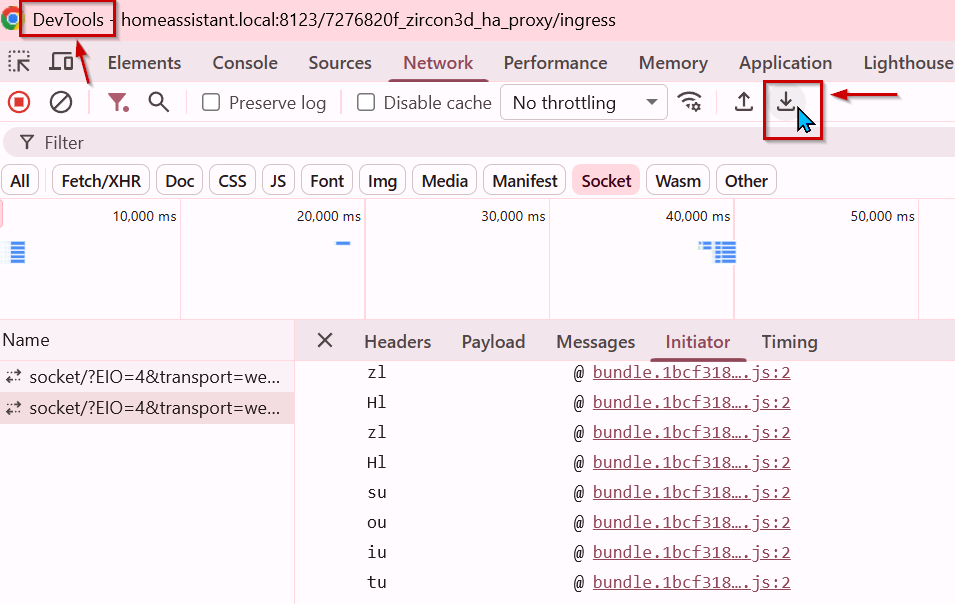
-
Hi,
Thank you for reporting the issue.
The issue does look unusual. That said, WebSocket connections are inherently more complex than normal HTTP requests and can be affected by several layers in the system (ingress, proxies, network, etc.), which can sometimes lead to instability like what you’re seeing.
A few clarifications first:
-
The Zircon3D CLoud UI does not read sensor data directly from Home Assistant. This is by design, for privacy reasons, zircon3D addon never expose sensor data outside of home network.
-
Zircon3D does not officially support remote access via Nabu Casa or third-party tunneling/proxy services such as Cloudflare.
- While some users have managed to make this work, we’re unfortunately not able to guarantee stability or provide official support in those setups.
Based on the logs and your setup, the most likely causes (in descending order) are:
- An issue with Home Assistant ingress
- An issue with a reverse proxy involved in the setup
- A local network–level issue
- VM becomes unstable due to insufficient resources (CPU, RAM etc)
To help narrow this down, we’d like to check these one by one.
Step 1: Bypass Home Assistant ingress
As a first test, please try accessing the Zircon3D UI directly, bypassing HA ingress:
http://192.168.2.248:11200/Notes:
- Port
11200is an alternative way to access the Zircon3D add-on UI. It’s not normally required for daily use. - This direct access is expected to be more stable because it bypasses HA ingress, which in our experience can sometimes be unreliable for WebSocket traffic.
Please let us know:
- Does accessing Zircon3D via
http://192.168.2.248:11200/resolve the connection issue? - Does the connection indicator remain stable and do sensor values appear correctly?
Once we know the result of this test, we can advise on the next steps.
-
-
For your information, after further discussion within our development team, we’ve decided to add a built-in debug panel to Zircon3D. This panel will surface detailed runtime information that can help diagnose subtle connection and environment-specific issues like this one.
We plan to ship this improvement as a hotfix for Zircon3D v2.0 within approximately one week.
-
Hi, thank you for the Information und your quick response.
Regarding your enquiry, I can say that I can use it without any problems outside of HA and all information can be displayed.
For your additional information, I have full access within HA via Nabu Casa.
This means that this is currently a useful delivery for me.
Thank you in advance. -
Hi, thank you for the Information und your quick response.
Regarding your enquiry, I can say that I can use it without any problems outside of HA and all information can be displayed.
For your additional information, I have full access within HA via Nabu Casa.
This means that this is currently a useful delivery for me.
Thank you in advance.@Hacker182
Hi,
We’ve released an improvement along with a new debug tool in Zircon3D v2.0.6 (2026-01-11).
Please upgrade the Zircon3D Proxy add-on to this version, it should be more stable, as we’ve enhanced the WebSocket connection handling.What’s new in v2.0.6:
- Improved WebSocket stability for unreliable or high-latency network environments
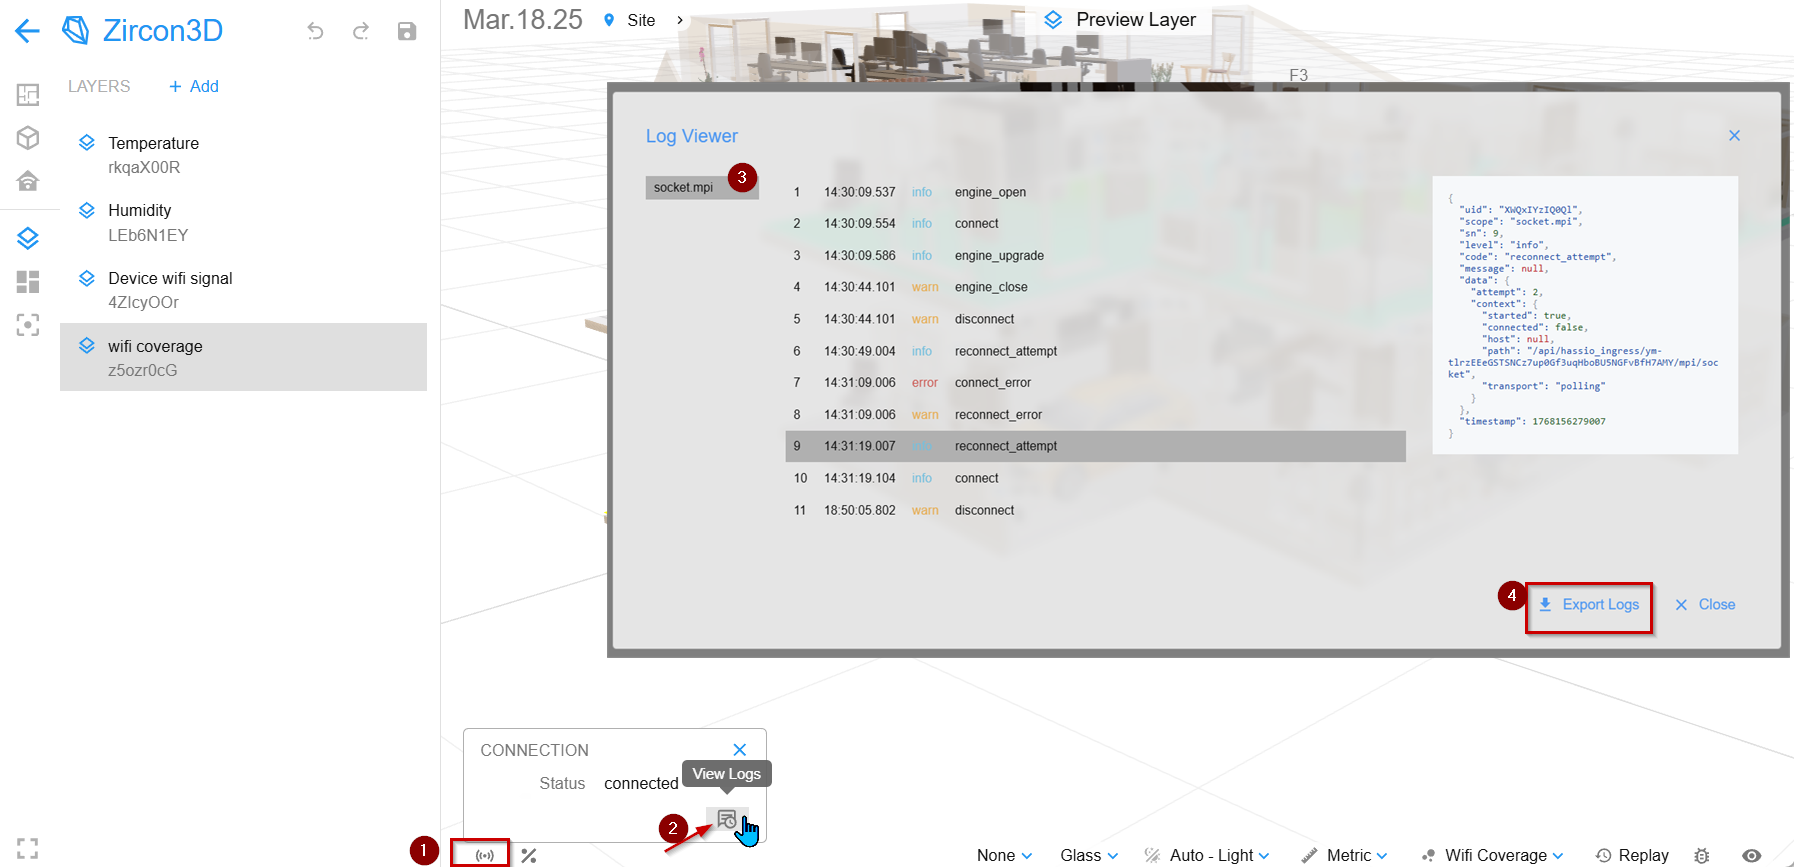
- Added a built-in log viewer to both the Designer and Viewer for easier debugging
If the connect/disconnect issue happens again, please do the following:
- When you see the Wi-Fi / connection icon toggling between connected and disconnected
- Click the icon to open the connection panel
- Click the Debug Info icon
- Export the log information and send it to us
I’ll attach a screenshot to show exactly where to find this option.
Thanks again for your patience and for helping us track this down, the new debug data will make it much easier for us to identify what’s happening if the issue persists.